The Bot Performance dashboard provides an in-depth view of containment & escalation rates, intent matching, and conversation & language trends. Use it to evaluate how effectively your bots are handling customer conversations and to identify areas for improvement.
Accessing the Bot Performance board
Via Unified Analytics
-
From the Application Bar, click Unified Analytics.
-
In the right panel, under Discover, select Bot.
-
Click Bot performance.
Via Bot
-
From the Application Bar, click Bot.
-
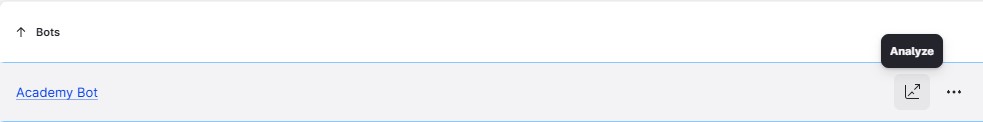
Ensure the Overview page is selected and navigate to the relevant bot.
-
Hover your cursor over the bot panel, and click on the Analyze icon.
-
In the left panel, select the Bot performance dashboard.
Selecting data sources
By default, the dashboard is empty until you select at least one data source.
-
In the controls bar (the menu bar along the top of the screen), click the Bots selector to open a drop-down menu of your available Bots.
-
Select the bot you want to review. Select All bots to view aggregate data across all your bots.
-
Optionally, use the Channels filter to select a specific channel or profile attached to your Bot.
-
Adjust the date range. The board defaults to the last 30 days.
The dashboard widgets will populate with data based on the selections you have made from the above filters.
Widgets
The Bot Performance dashboard contains the following widgets.
Containment
Conversations by containment
The total number of conversations started during the selected date range, divided into Contained and Escalated categories. Use this widget to assess overall bot containment and track the effectiveness of your conversational flows over time and how often human assistance is required by your customers.
A contained conversation is one that was fully resolved within the bot without human escalation.
Contained conversations
The total number of bot conversations that were fully resolved within the bot without escalation to a live agent during the selected date range. Use this widget to easily identify the total volume of contained conversations within the defined date range.
Escalated conversations
The total number of bot conversations that were escalated to a live agent during the selected date range. Use this widget to easily identify the total volume of escalated conversations within the defined date range.
Containment trend over time
An overview of contained versus escalated conversations during the selected date range, filtered by date. Use this widget to track whether your bot's ability to resolve conversations without escalation is improving or declining over time.
Contained conversations by channel
The distribution of contained conversations during the selected date range, filtered by messaging channel (for example, Webchat, Facebook Messenger, Instagram DMs etc). Use this widget to identify which channels your bot handles most effectively without requiring agent escalation and which channel your customer audience tends to gravitate towards.
Escalated conversations by channel
The distribution of escalated conversations during the selected date range, filtered by channel. Use this widget to identify which channels are generating the most escalations and may require adjustments to their conversational flows or additional support dedicated to them by your human teams.
Containment rates by platform
The containment rate for bot conversations during the selected date range, filtered by platform. This widget provides a volume breakdown of conversation volumes, escalated conversations, and contained conversations by messaging platforms. Use this widget to easily identify your total containment & escalation rates across messaging channels and understand where targeted improvements would be most impactful across your supported channels.
Intents
Intent matches
The total number of user messages that were successfully matched to an intent by your bots during the selected date range. Use this widget to understand the overall scale of recognized user queries and track whether your configured intents are effectively identifying expressed queries from your users.
If you have not correctly configured intents in your bot, this analysis will not display correctly.
Intent matches by language
The distribution of intent matches for all bot conversations that started during the selected date range, filtered by language. Use this widget to understand how intent matching performance varies across the languages your bots support, and identify languages that may require additional intent support or refinement.
Intent matches by platform
The distribution of intent matches for all bot conversations that started during the selected date range, filtered by platform (for example, Webchat, Facebook Messenger, Instagram DMs etc). Use this widget to identify whether certain channels drive different patterns of user queries and tailor your intent profiles accordingly.
Messages & Conversations
Total volume of conversations
The total volume of conversations that were initiated with your bot during the selected date range. Use this widget to monitor overall conversation volume and identify trends in how frequently customers are engaging with your bots.
Total volume of messages
The total number of user messages (within conversations) received by your bots during the selected date range. Use this widget to track overall message volume and gain insight into how many messages are required to resolve a customer query.
Last 12 Month Overview
New Conversations Trend - 12 Months
An overview of the total volume of new conversations initiated with the selected bot(s) over a 12 month period, filtered by day and month. Use this widget to identify long-term trends in conversation volume and assess bot adoption and growth over time.
Monthly Conversations Trend - 12 Months
The total volume of new conversations initiated with the selected bot(s) over a 12 month period, filtered by calendar month. Use this widget to review month-over-month conversation trends and identify potential seasonal patterns in bot usage.
Further recommendations