Stay on top of your chat bots' performance
The Analytics Dashboard provides detailed statistical reports on the performance of all your company's bots. These reports allow you to determine how successfully your bots are engaging customers, and how they could be improved. You can adjust each report's display settings in order to get a more comprehensive view of the data coming in from your bots.
Accessing the analytics dashboard
-
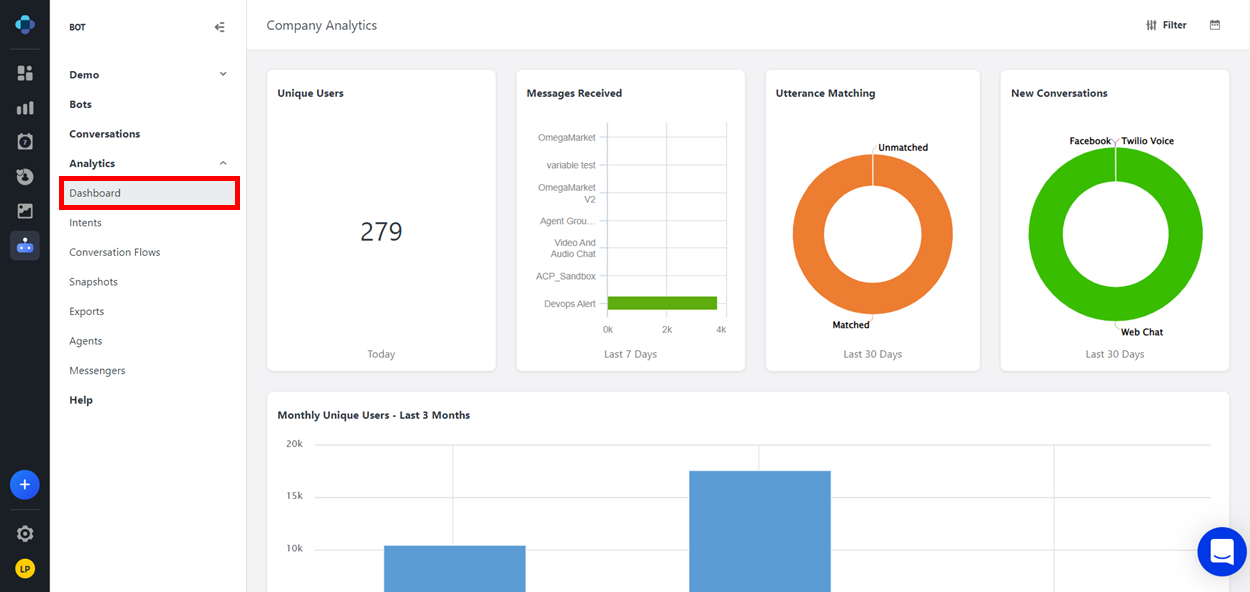
From the Application Bar, click Analytics.
-
Click Dashboard.
Analytics dashboard layout
The Analytics Dashboard consists of widget spaces where you can add a customizable selection of reports. It also contains a Global Date Range button and a Bot Filter button in the upper right corner of the page.
Global date range button
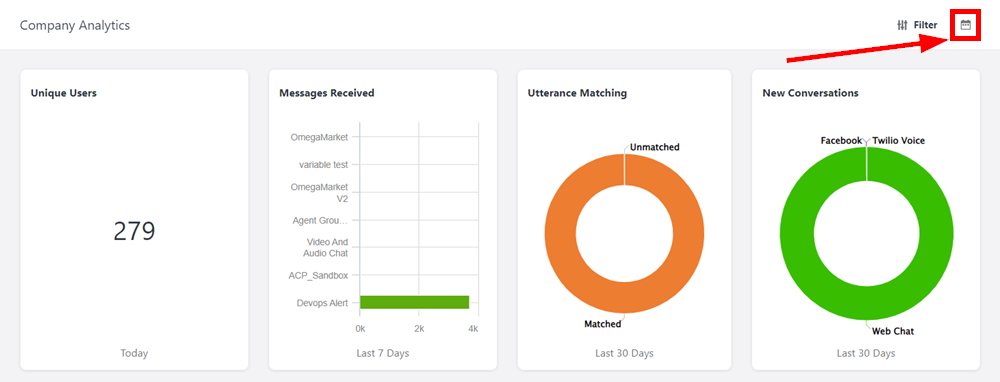
Click here to set the date range for all reports on the Analytics Dashboard.
If you select Custom from the drop-down menu, a calendar appears for you to select a start date and an end date.
-
After you make your selections and click Apply, the reports adjust to display data from this range.
-
Click Clear to reset the calendar.
Bot filter button
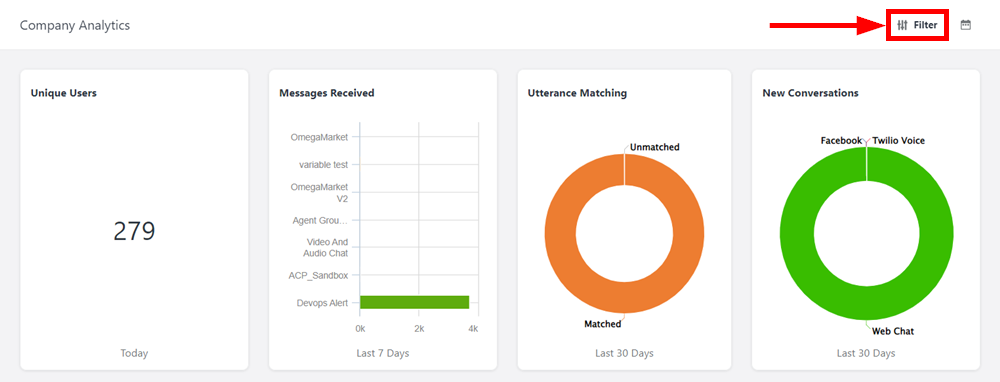
Click here to display a drop-down menu containing a list of all your company's bots.
Select a bot to display only its data on all the reports on the Analytics Dashboard.
Select All Bots to display the collective data for all your company's bots.
Reports
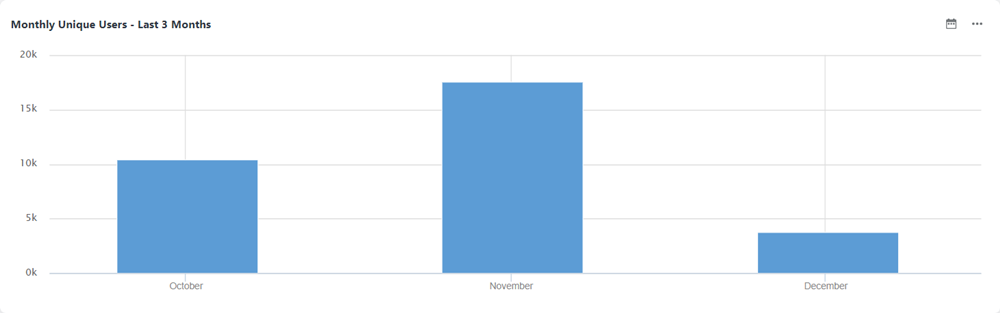
On the Analytics Dashboard, there are widget spaces where you can add a customized selection of reports. The top row contains four small widget spaces where you can display report snapshots, and the bottom two rows each contain a large widget space that displays your data through trend graphs, allowing you to view how your data has changed over time.
The dashboard's appearance is unique to each Emplifi Bot user. If you add or delete a report from a widget space, it will only affect your dashboard, not those of other Emplifi Bot users.
Adding and deleting reports
Click the Add button in an empty widget to display a drop-down menu, from which you can choose a report to add to your dashboard.
If there are no empty widgets on the dashboard, open up space by deleting a report. To do so, click the Settings button in the upper right corner of the report, then from the drop-down menu that appears, click Remove.
Exporting report data
Reports contained in a large widget space allow you to download their data in the form of a comma-separated value (CSV) file. To do so:
-
In the report, click the Settings button . A drop-down menu displays.
-
From the drop-down menu, click Export to CSV. The file will automatically download.
Exporting is not available for the Bot Performance report.
Types of reports
Agent chat escalations
This report shows the number of times that users have been escalated to a live chat with an agent during the specified time period.
This type of report tracks the escalations that go to the old Emplifi SOS platform, not those that go to the newer Emplifi Agents platform.
Bot performance
This report shows a combination of 1.) the number of different users who have interacted with your company's bots, in the form of a line chart, and 2.) the number of user statements that have been matched by the bots' intent engines compared to the number that were not matched, in the form of a column chart. Each metric is shown over the same specified time period.
This type of report is only available in a large widget.
Conversation flow visits
This report shows the number of times that your bots' conversation flows have been visited (not necessarily by unique users) during the specified time period. This can be broken down by individual bot, platform, conversation flow, or overall for your company.
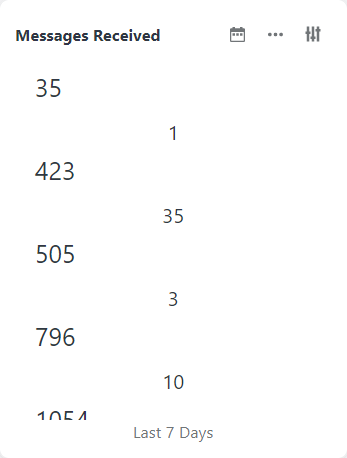
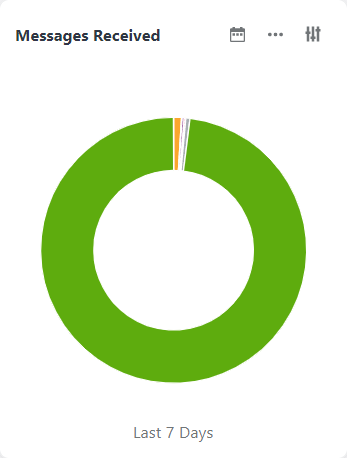
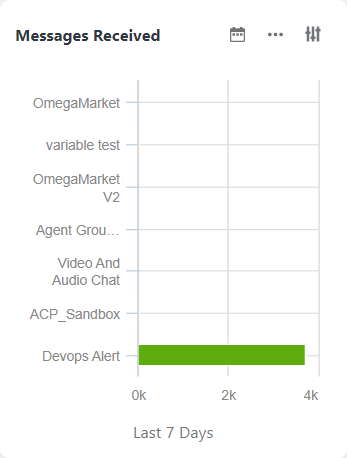
Messages received
This report shows the number of messages sent to all of your company's bots by users during the specified time range. This includes both prompted and unprompted user messages. This can be broken down by individual bot, or by platform (e.g. web chat, Messenger, etc.).
Containment
This report shows the bot’s performance in handling (or containing) conversations without escalating the conversation to an agent. This widget shows the number of contained bot conversations verses the number of uncontained (escalated) conversations.
New conversations
This report shows the number of new, unique conversations that have been initiated with all of your bots in the specified time period. This can be broken down by individual bot, or by platform.
Reactions
This report shows the number of reactions that your bots have received over a specified time period. This will only show data if your bots are utilizing emoticons like smiley faces, or thumbs up and thumbs down reactions.
Returning users
This report shows the number of individual users who have interacted with any of your bots on multiple occasions during the specified time range.
When a user sends a message, Bot checks if that user has sent other messages within the last 30 days. If Bot finds a message from that user which is at least 8 hours older than their latest message, the user is counted as "returning".
The Returning Users report is only calculated for channels where Bot knows that the user is the same. Anonymous web channels, for instance, will likely not count any users as returning, because their identities cannot be verified.
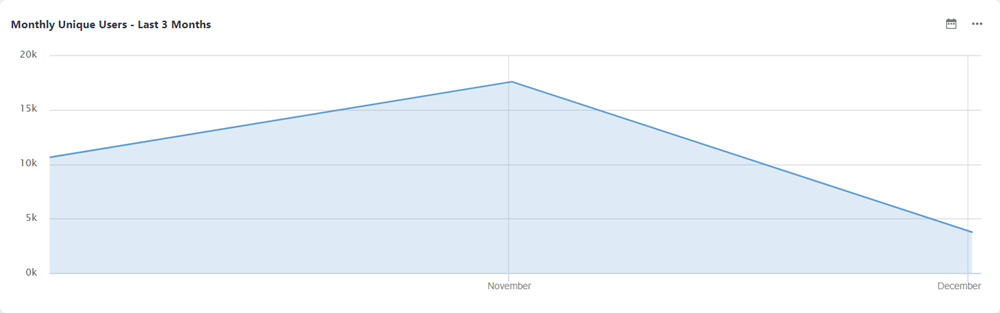
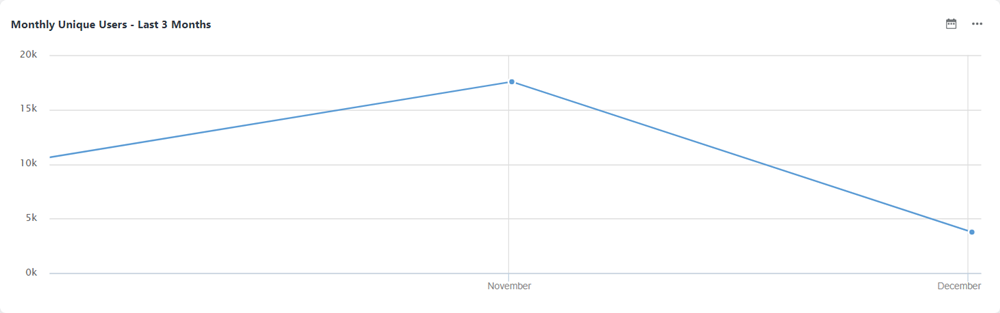
Unique users
This report shows the number of different users who have interacted with any of your bots during the specified time range.
Utterance matching
This report shows the number of user statements that have been matched by the bot's intent engine compared to the number of statements that have not been matched.
This type of report is only available in a small widget.
Report buttons
Hover over a report to display a row of buttons in its top right corner.
|
Button |
Description |
|---|---|
|
|
Click here to choose the date range of the report. If you select Custom from the drop-down menu, a calendar will appear for you to select a start date and an end date.
|
|
|
Click here to adjust the report's formatting options. The drop-down menu varies by report, and can include the following sections:
|
|
|
Click here to filter the report's data. Select a filter from the list of available filters and click Apply. The report will adjust to display only the filtered data. |
Report Chart Type Options
Small Widgets
-
List
-
Pie Chart
-
Bar Chart
Large Widgets
-
Area Chart
-
Line Chart
-
Column Chart