The Bot Overview dashboard gives you a high-level summary of incoming conversation volumes, message volumes, unique user activity and messaging platform division across your bots. Use it to quickly assess overall bot traffic and track how many users your bots are reaching over time.
Accessing the Bot overview board
Via Unified Analytics
-
From the Application Bar, click Unified Analytics.
-
In the right panel, under Discover, click Bot.
-
Under Bot, select Bot overview.
Via Bot
-
From the Application Bar, click Bot.
-
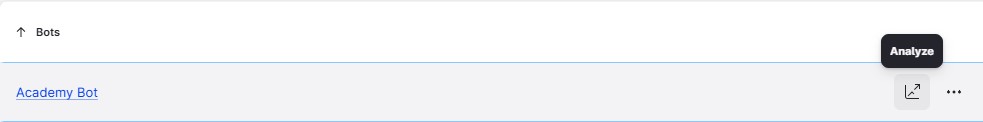
Ensure the Overview page is selected and navigate to the relevant bot.
-
Hover your cursor over the bot panel, and click on the Analyze icon.
-
In the left panel, ensure the Bot overview dashboard is selected.
Selecting data sources
By default, the dashboard is empty until you select at least one data source.
-
In the controls bar (the menu bar along the top of the screen), click the Bots selector to open a drop-down menu of your available Bots.
-
Select the bot you want to review. Select All bots to view aggregate data across all your bots.
-
Optionally, use the Channels filter to select a specific channel or profile attached to your bot.
-
Adjust the date range. The board defaults to the last 30 days.
The dashboard widgets will populate with data based on the selections you have made from the above filters.
Widgets
The Bot Overview dashboard contains the following widgets.
New conversations
This displays the total number of new conversations that started during the selected date range (this does not include any in-progress conversations that may have started outside of the configured date range). Use this widget to track how frequently customers are initiating interactions with your bots and the total number of new conversations started by new users.
New conversations are determined by reading the first message of a conversation started during this time period and are not impacted by conversation breaks.
A conversation is defined as all of the individual messages exchanged within a continuous interaction.
Incoming messages
The total number of user messages received by your bots during the selected date range. Use this widget to monitor overall message volume and gain insight into how many messages are exchanged within conversations.
Unique users
The total number of unique users who started a conversation during the selected date range. Use this widget to understand how many new customers your bots are serving.
A unique user is defined as a customer engaging in a conversation with the Bot for the first time.
Returning users
The total number of users who interacted with your bots on more than one occasion during the selected date range. Use this widget to understand user loyalty and track how well your bots are driving repeat engagement.
A returning user is defined as a customer engaging in a conversation with the Bot who has interacted with the Bot previously.
Daily incoming messages
An overview of the total number of incoming user messages received during the selected date range, filtered by day. Use this widget to spot daily patterns in message volume and identify unusually high or low-traffic days.
Messages are the individual messages within a specific conversation. A higher volume than conversations typically displays.
Incoming messages by platform
The distribution of incoming user messages during the selected date range, filtered by messaging platform (for example, Webchat, Facebook Messenger, Instagram DMs etc). Use this widget to understand which channels are generating the most message volume and compare activity across platforms.
Daily incoming conversations
An overview of the total number of incoming bot conversations during the selected date range, filtered by day. Use this widget to track daily conversation patterns and identify spikes or drops in bot engagement over time.
Incoming conversations by platform
The distribution of incoming bot conversations during the selected date range, filtered by platform (for example, Webchat, Facebook Messenger, Instagram DMs etc). Use this widget to easily understand which channels are driving the most bot interactions and your biggest source of contact.
Conversations and messages by platform
An overview of both conversation volume and message volume during the selected date range, filtered by platform. Use this widget to compare activity volumes across channels and easily assess where your greatest sources of customer engagement are in terms of messaging platform.
Further recommendations