Unified Analytics brings together data from across the Emplifi platform into one centralized reporting experience. Instead of switching between modules, you can view performance metrics, compare results, and analyze trends, all in one place.
Unified Analytics overview
With Unified Analytics, you can:
-
View performance across multiple Emplifi products
-
Analyze data across platforms and accounts
-
Drill down into detailed metrics
-
Set custom timeframes
-
Compare performance across date ranges
-
Interact with visualizations to explore insights
As soon as your data sources are connected (social profiles, ad accounts, listening queries, etc.), boards automatically populate with ready-made visualizations.
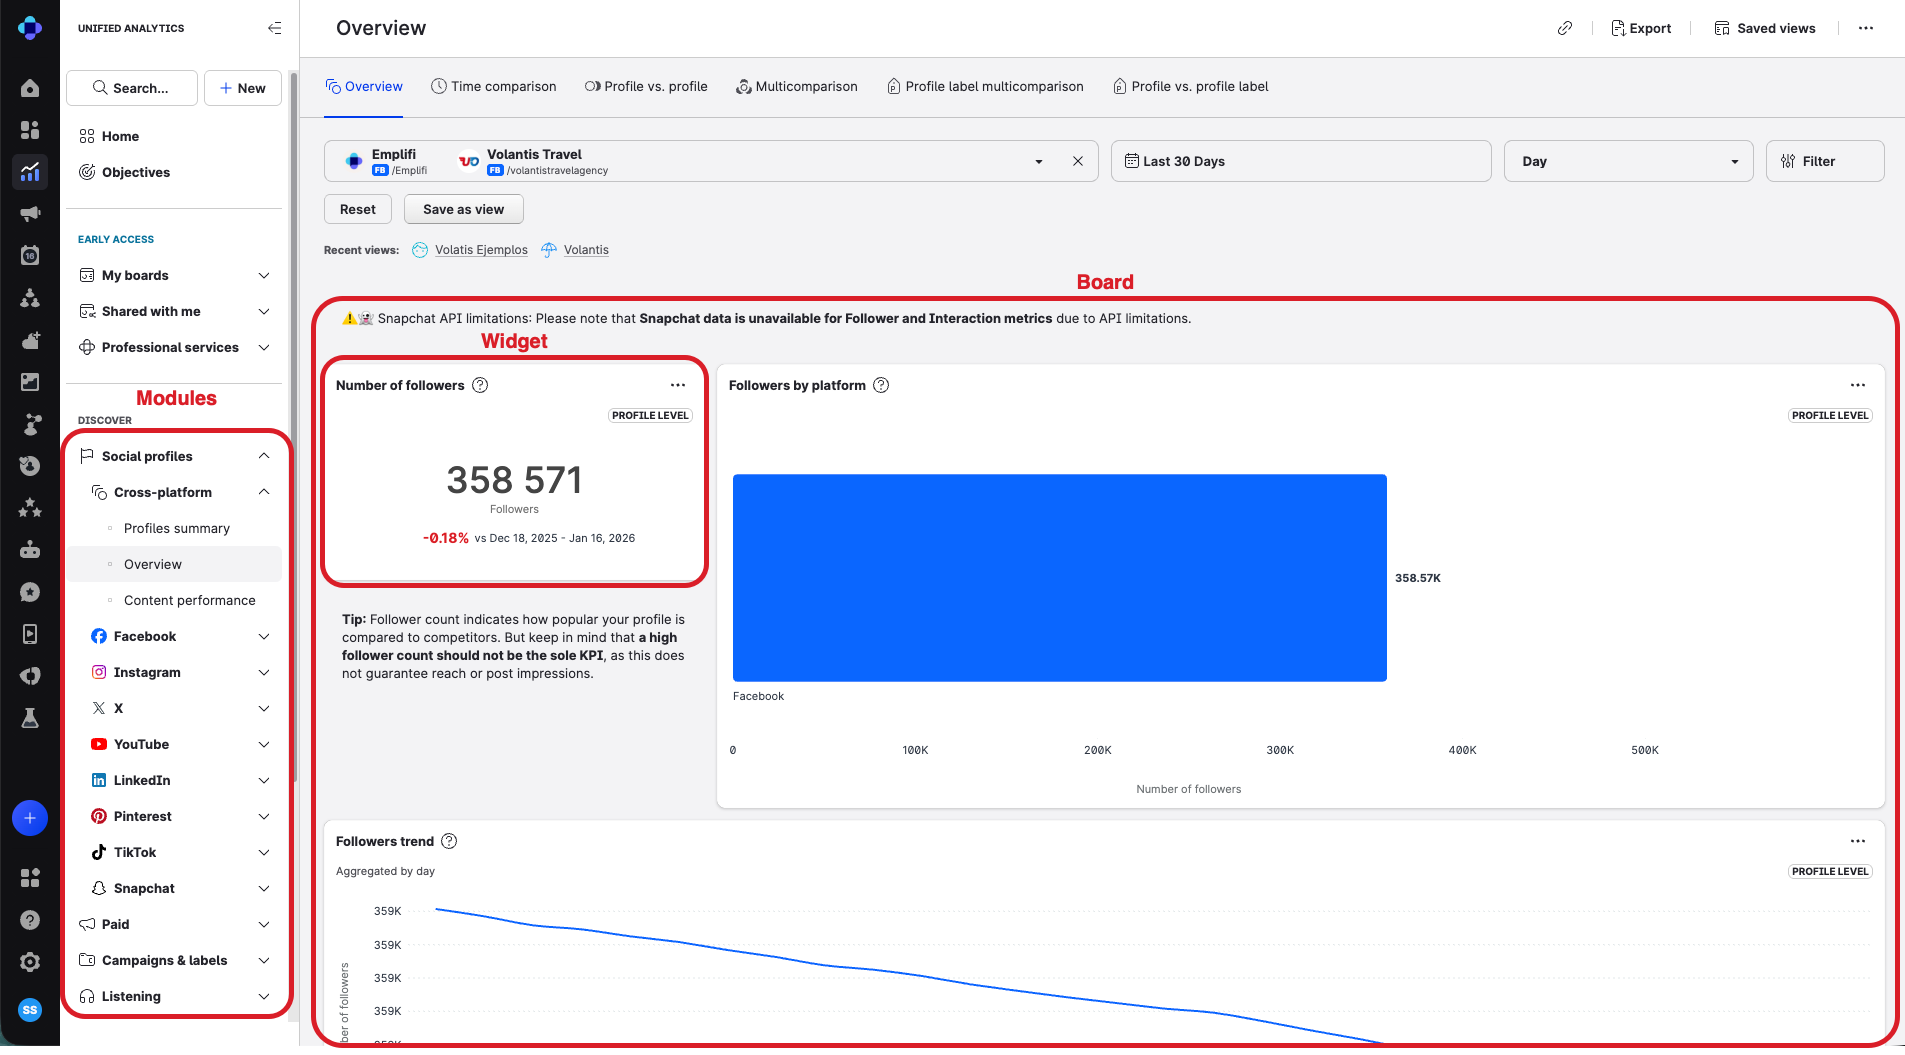
Unified Analytics structure
Unified Analytics is structured into modules, boards, and widgets. Understanding this structure makes it easier to navigate and customize your analysis.
Refer to the sections below to learn more about each component of Unified Analytics.
Modules
A module groups boards based on a specific product or use case.
Each module focuses on a particular area of analytics. Refer to the sections below for details about the available modules.
Social Profiles
Analyze owned and public social profile performance — on individual platforms or across platforms.
Available data sources:
-
Owned social profiles (with insights)
-
Public social profiles
-
Profile labels
Paid
Measure advertising performance.
Available data sources:
-
Ad accounts
-
Campaigns
Campaigns & Labels
Evaluate content performance using labeling.
Available data sources:
-
Content labels
Listening
Track and analyze listening query performance.
Available data sources:
-
Listening queries
Care
Monitor agent and supervisor performance in Care.
Available data sources:
-
Agent activity
-
Supervisor activity
Bot
Review bot performance and effectiveness.
Available data sources:
-
Bots
Link in Bio
Available data sources:
-
Link in Bio pages
Live Commerce
Available data sources:
-
Live Advisor
UGC
Analyze social and content performance across channels, types and creators, and understand engagement and conversion rates at each stage of the purchase funnel.
Available data sources:
-
UGC
Coming Soon
-
Community
-
Ratings & Reviews
-
Knowledge
-
Agent
Boards
A board is a workspace within a module.
Each board contains multiple widgets that visualize related metrics for a specific reporting focus (for example, engagement, reach, or campaign performance).
Boards are:
-
Pre-built and ready to use
-
Automatically populated when data sources are connected
-
Designed around common reporting needs
For more details, refer to: Unified Analytics - Boards Overview.
Widgets
A widget is a visual representation of data.
Widgets:
-
Display specific metrics
-
Are pre-configured (no setup required)
-
Use defined visualization types (charts, graphs, tables, etc.)
-
May include interactive elements for deeper exploration
Many widgets allow you to:
-
Drill down into data
-
Change timeframes
-
Compare performance across periods
-
Filter by profiles, campaigns, or labels
For more details, refer to: Unified Analytics - Widgets Overview.
Controls
Controls allow you to adjust what data is displayed on a board or widget.
Examples of controls include:
-
Timeframe selection
-
Time comparison range
-
Profile or account selection
-
Filters
Controls dynamically update all relevant widgets on the board.