Unified Analytics is made up of various modules, boards, and widgets.
In the right side panel under Discover, you can see the modules, such as Social profiles, Paid, Campaigns & labels, etc. Modules are made up of various boards.
A board is a workspace made up for individual widgets, which display data visualizations.
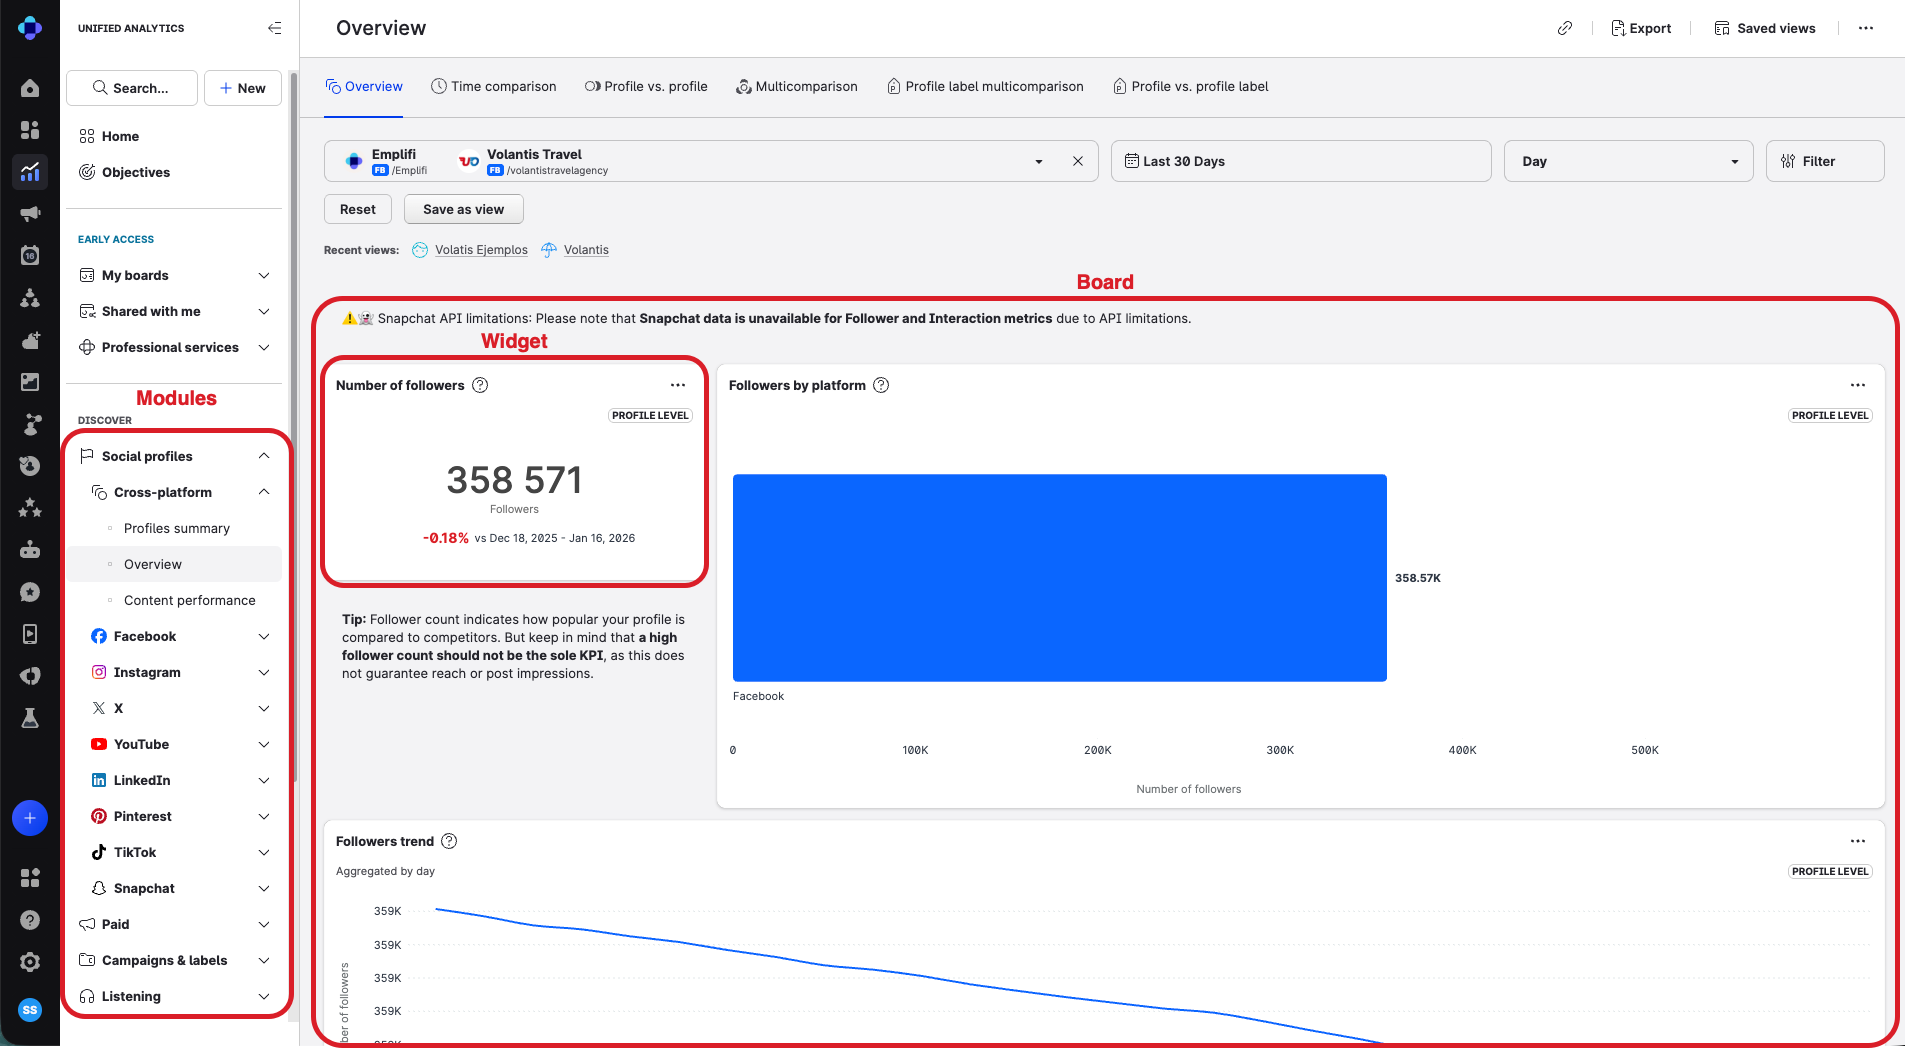
As Unified Analytics modules are pre-defined and loaded with widgets, all you need to do is specify the data sources.
Select your board’s data sources
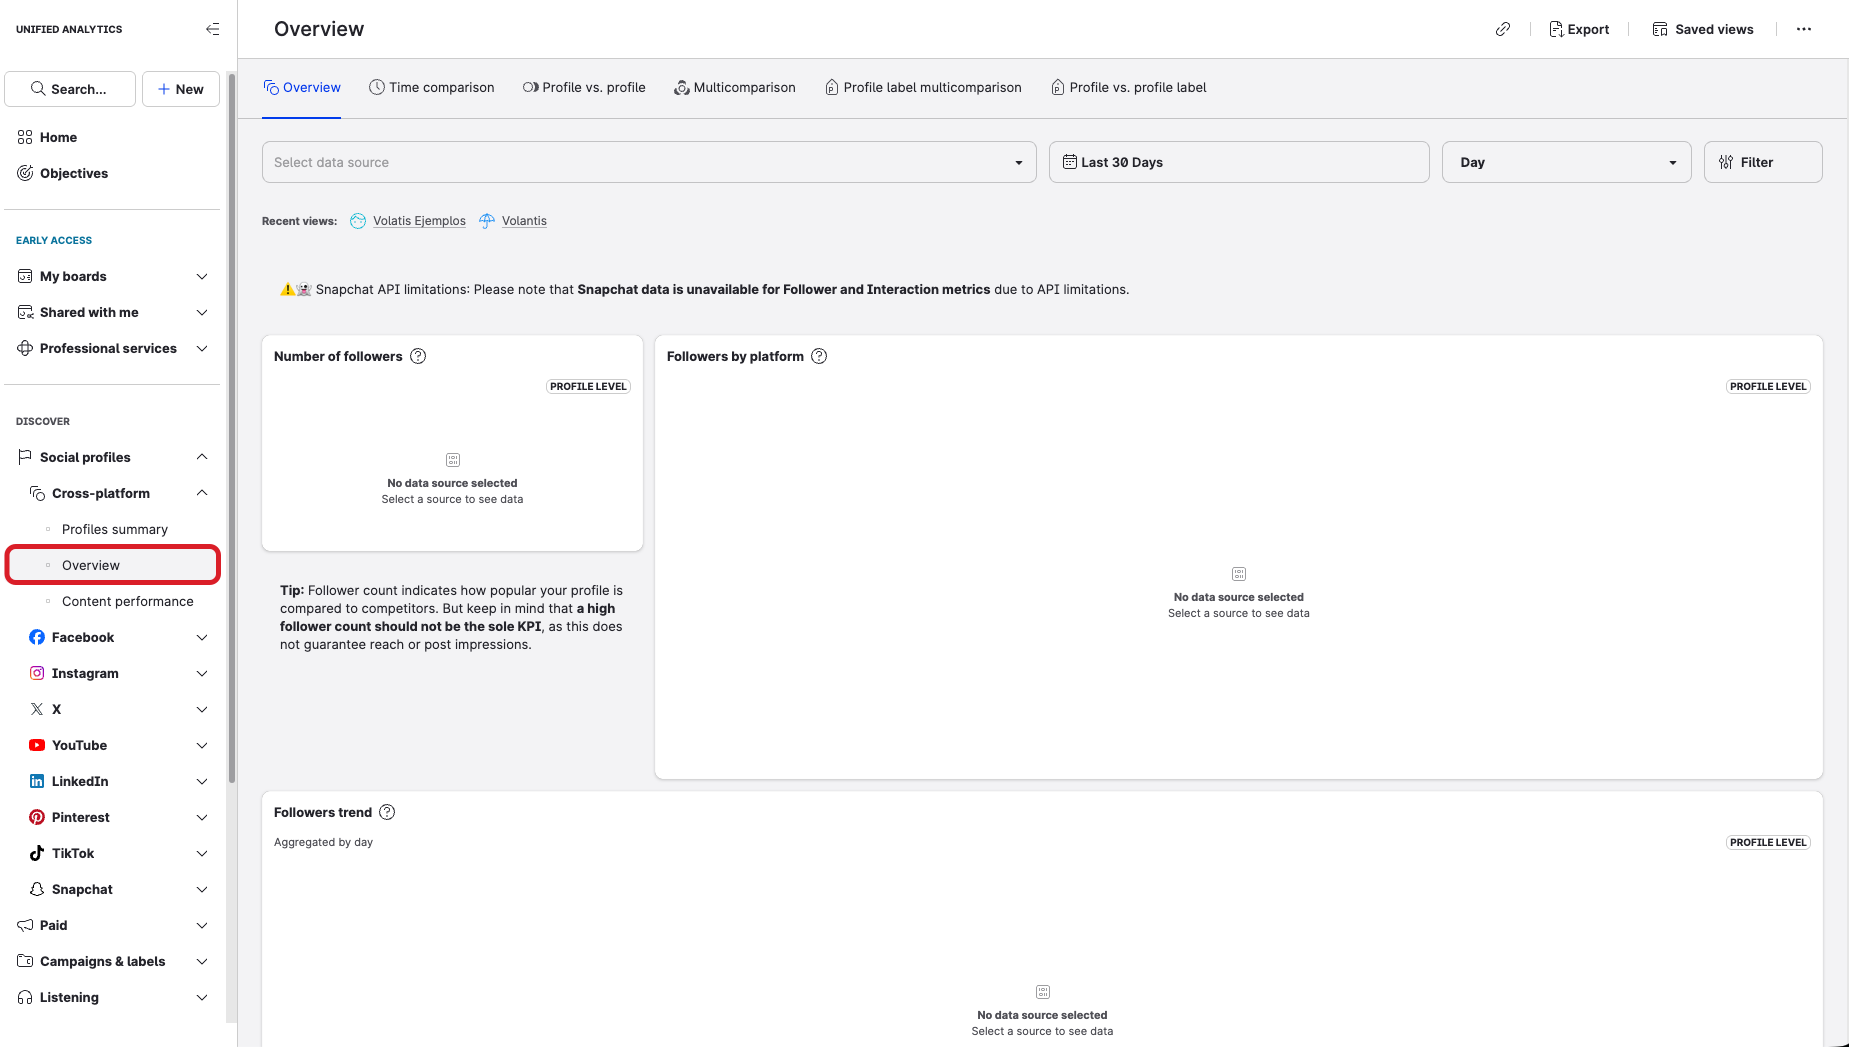
By default, boards are empty and you must choose the data source or sources that you want to analyze.
A data source can be a profile, platform, labels, bot, etc. depending on the module and/or board. You can select one or multiple items from the list.
To select your board’s data sources:
-
In Unified Analytics, navigate to the relevant module that contains the board. A blank pre-defined board appears.
-
In the controls bar, define your preferred data sources. For example, for a Social profiles board, you may select your owned Instagram profiles.
-
Optionally, adjust the date range. By default, boards load and analyze the last 30 days of data. To change that, simply click the time period control (that says Last 30 days) and adjust the time span.
To compare two time periods head to head, refer to: Time Over Time Comparison in Unified Analytics.
-
Optionally, adjust the aggregation type. You can display trends and evolution charts aggregated by day, week, month, quarter, or year.
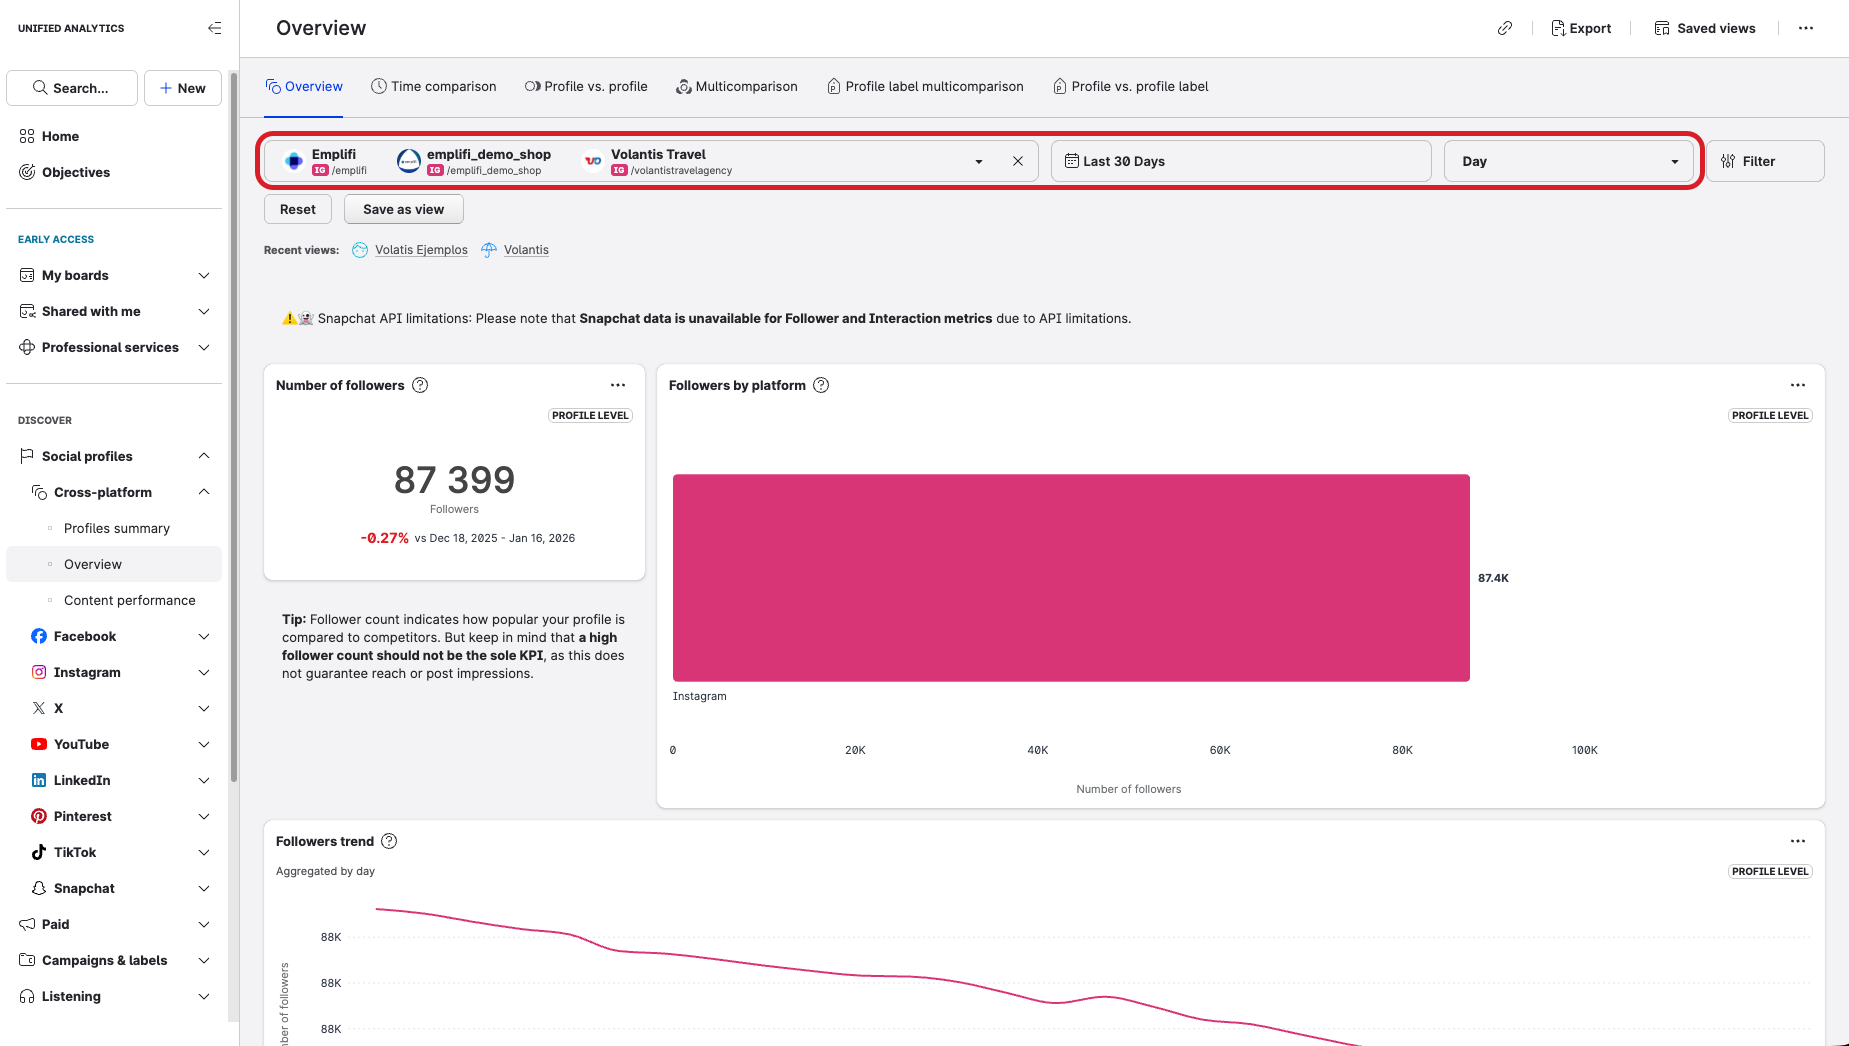
Unified Analytics connects to the data sources and displays visualizations of your data.
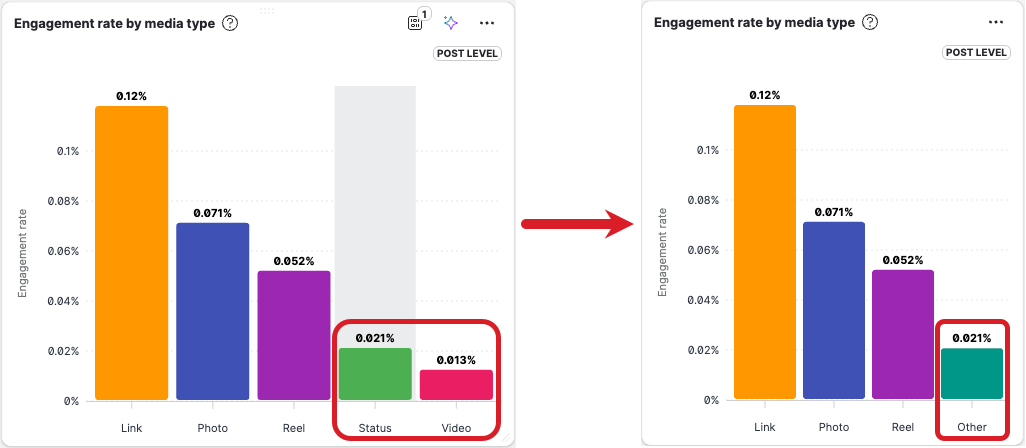
For boards with vertical bar charts with many bars, if all bars cannot fit within the widget’s width, an aggregated “Other” bar will appear. The bars with the lowest values (typically those on the right) that do not fit within the selected width and widget size will be grouped into the “Other” category.
To view the entire data set, export the data as an XLSX or CSV file. For more details, refer to: Share a Unified Analytics Board or Share a Unified Analytics Widget.
If you select multiple data sources, you will be able to see aggregated data and basic comparisons among of the sources, such as profiles, that you selected. For more information, refer to: Compare a Profile with Another Profile.
Control widget variations with toggles
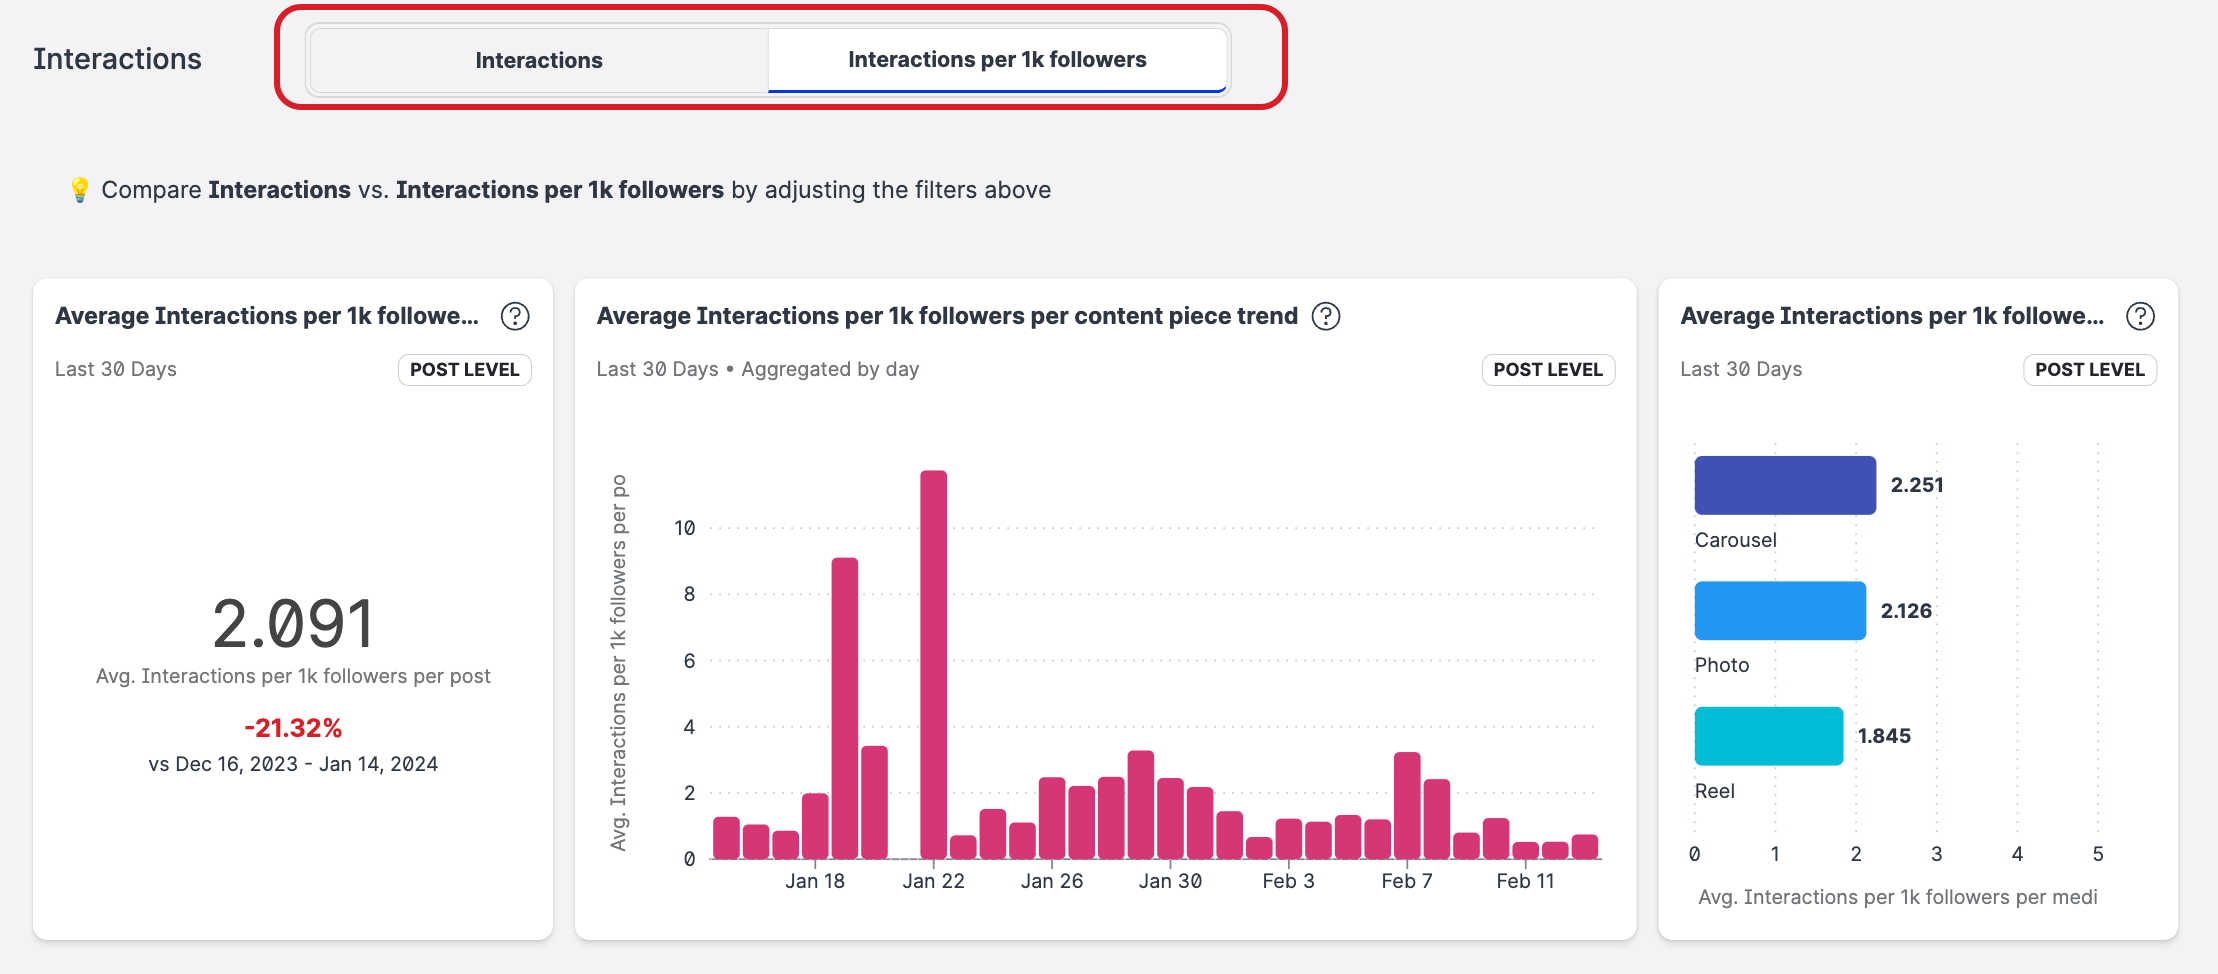
Certain widgets allow you toggle between displaying visualizations of different sets of data.
Toggles are currently supported for the following data:
-
Organic vs Paid data split is supported on Facebook and Instagram boards. For more information, refer to: Paid and Organic Data in Unified Analytics
-
Interactions vs Interactions per 1k followers* is supported in boards within the following modules:
-
Facebook
-
Instagram
-
X (formerly known as Twitter)
-
YouTube
-
LinkedIn
-