Compare a Profile with Another Profile
Unified Analytics boards allow you to select multiple profiles and see the comparison of aggregated data across individual platforms on all of its main boards.
To compare individual profiles directly and in greater details, you have two options
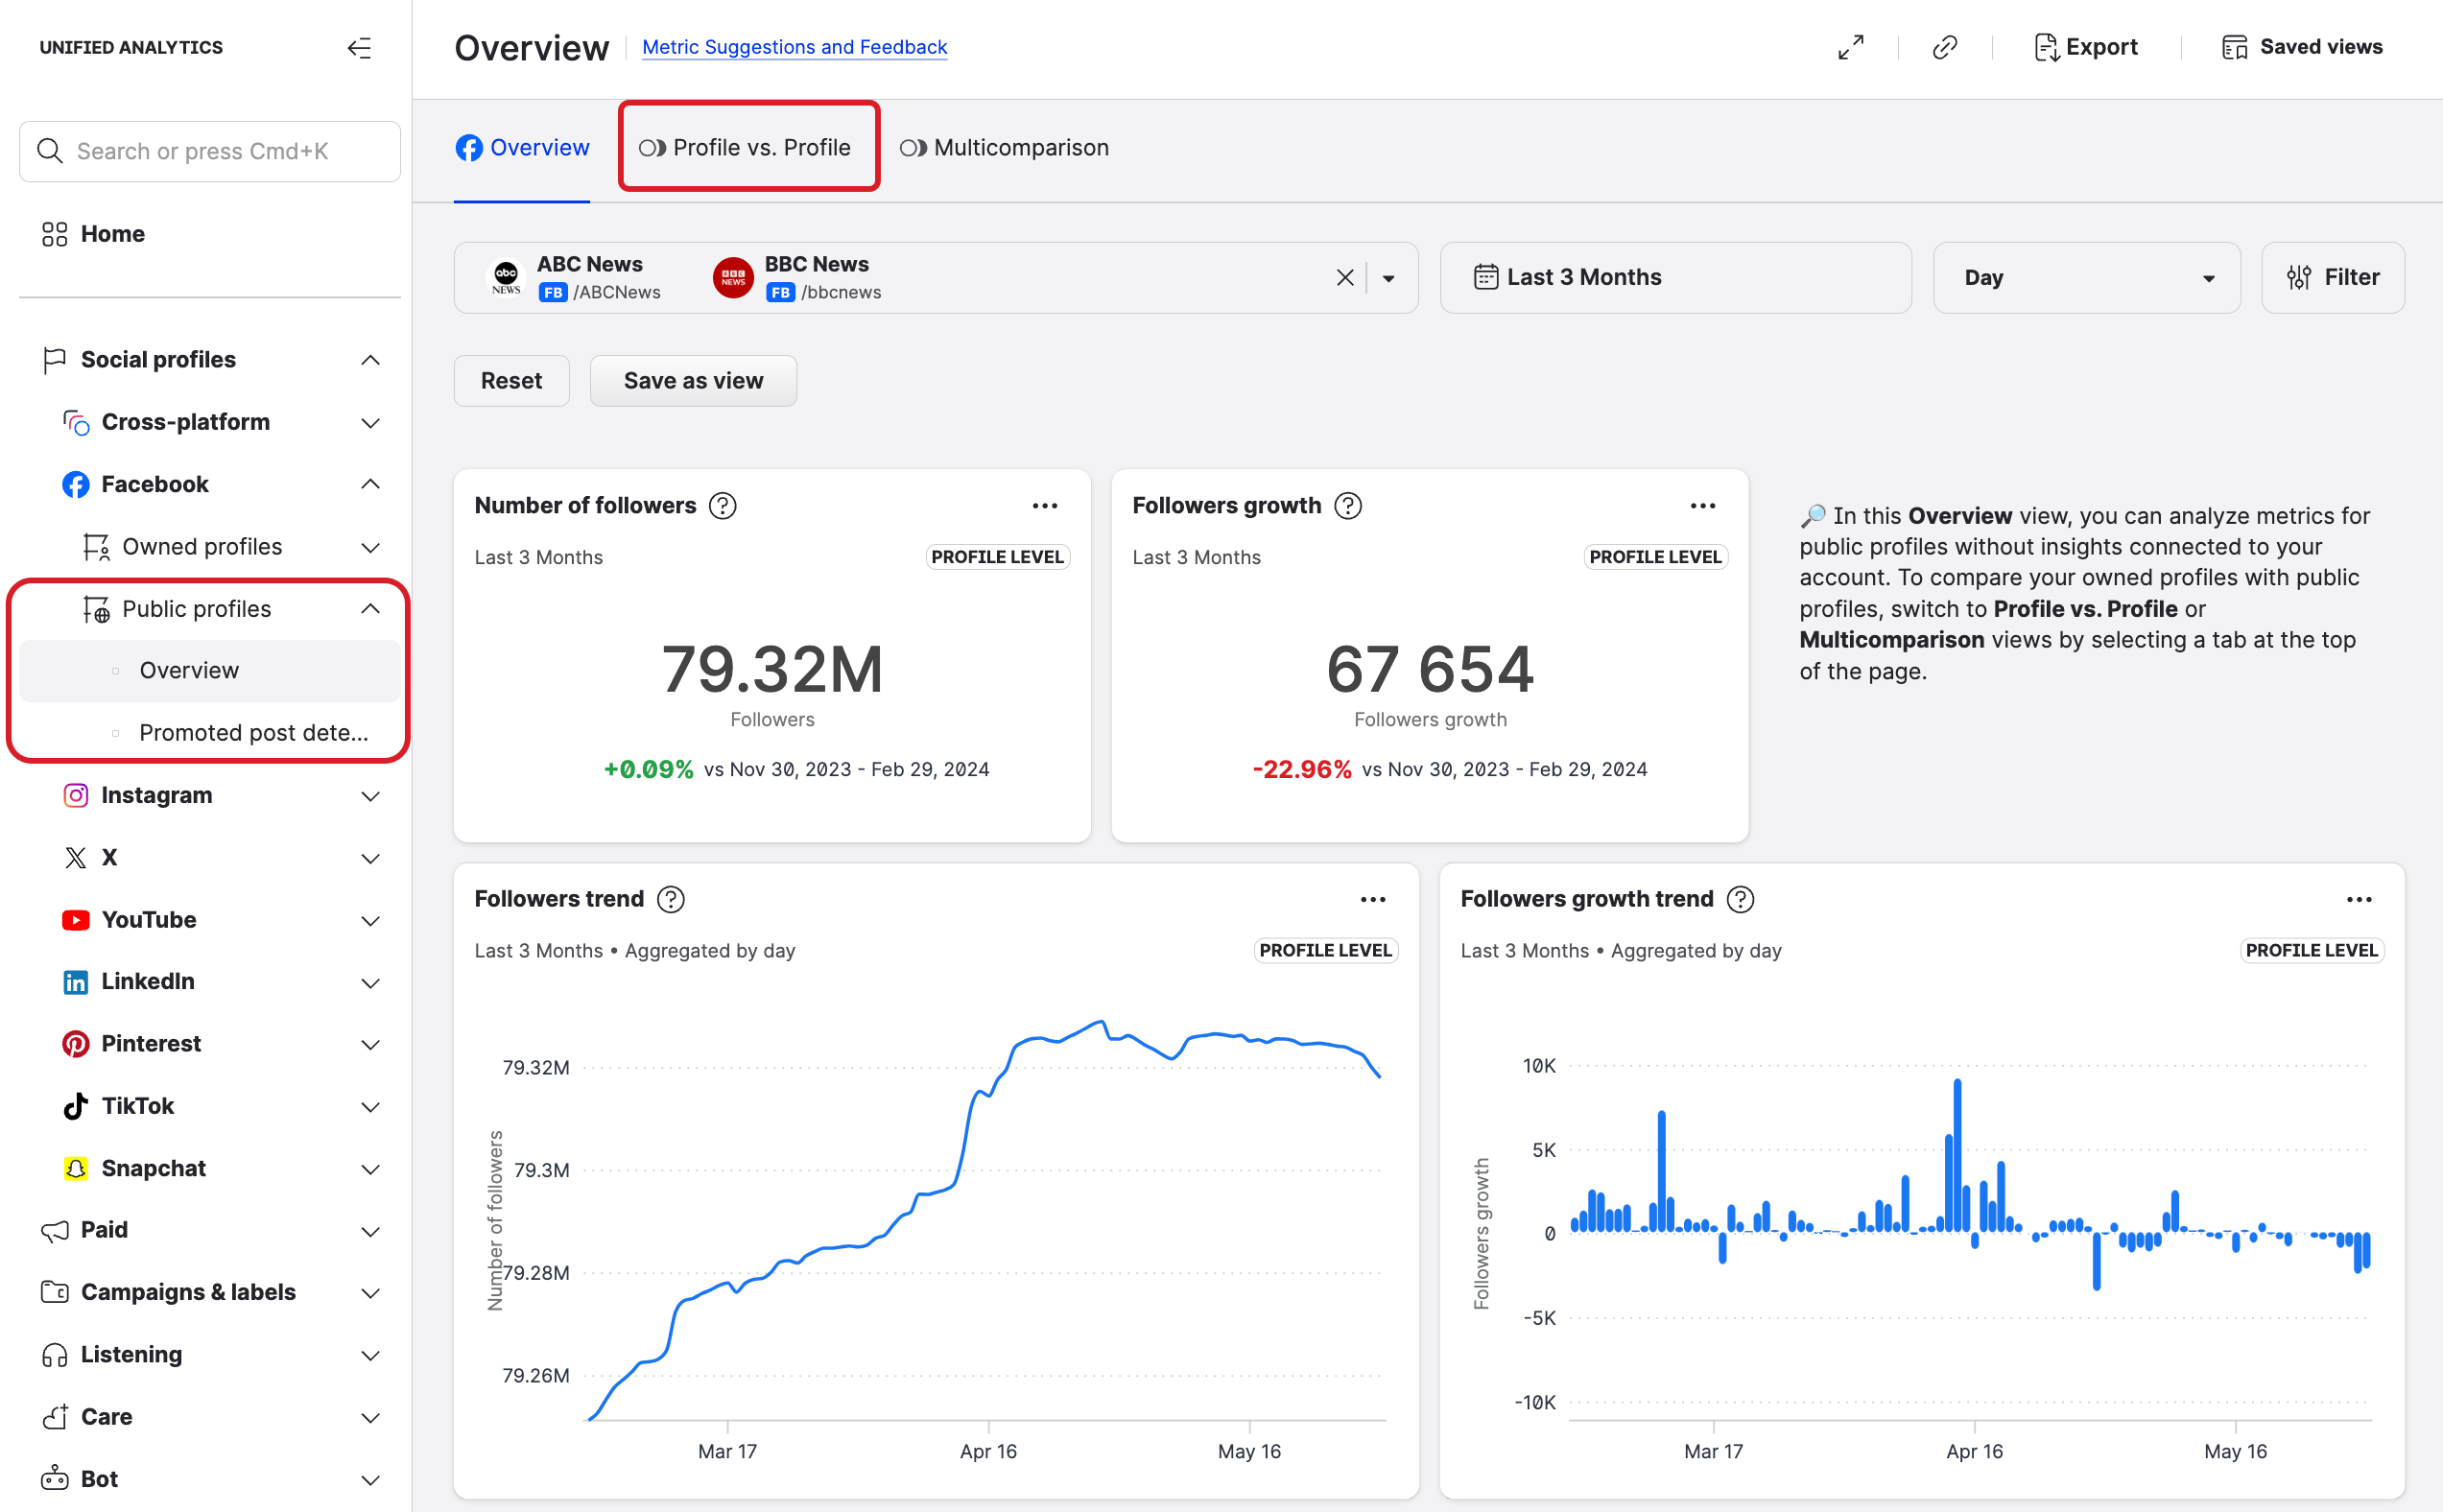
To compare two profiles head to head, click the Profile vs profile tab.
To compare several profiles side by side, click the Multicomparison tab.
You can also analyze and compare performance of public profiles on selected social media platforms. See Working with Public Profiles in Unified Analytics.
Profile vs Profile comparison
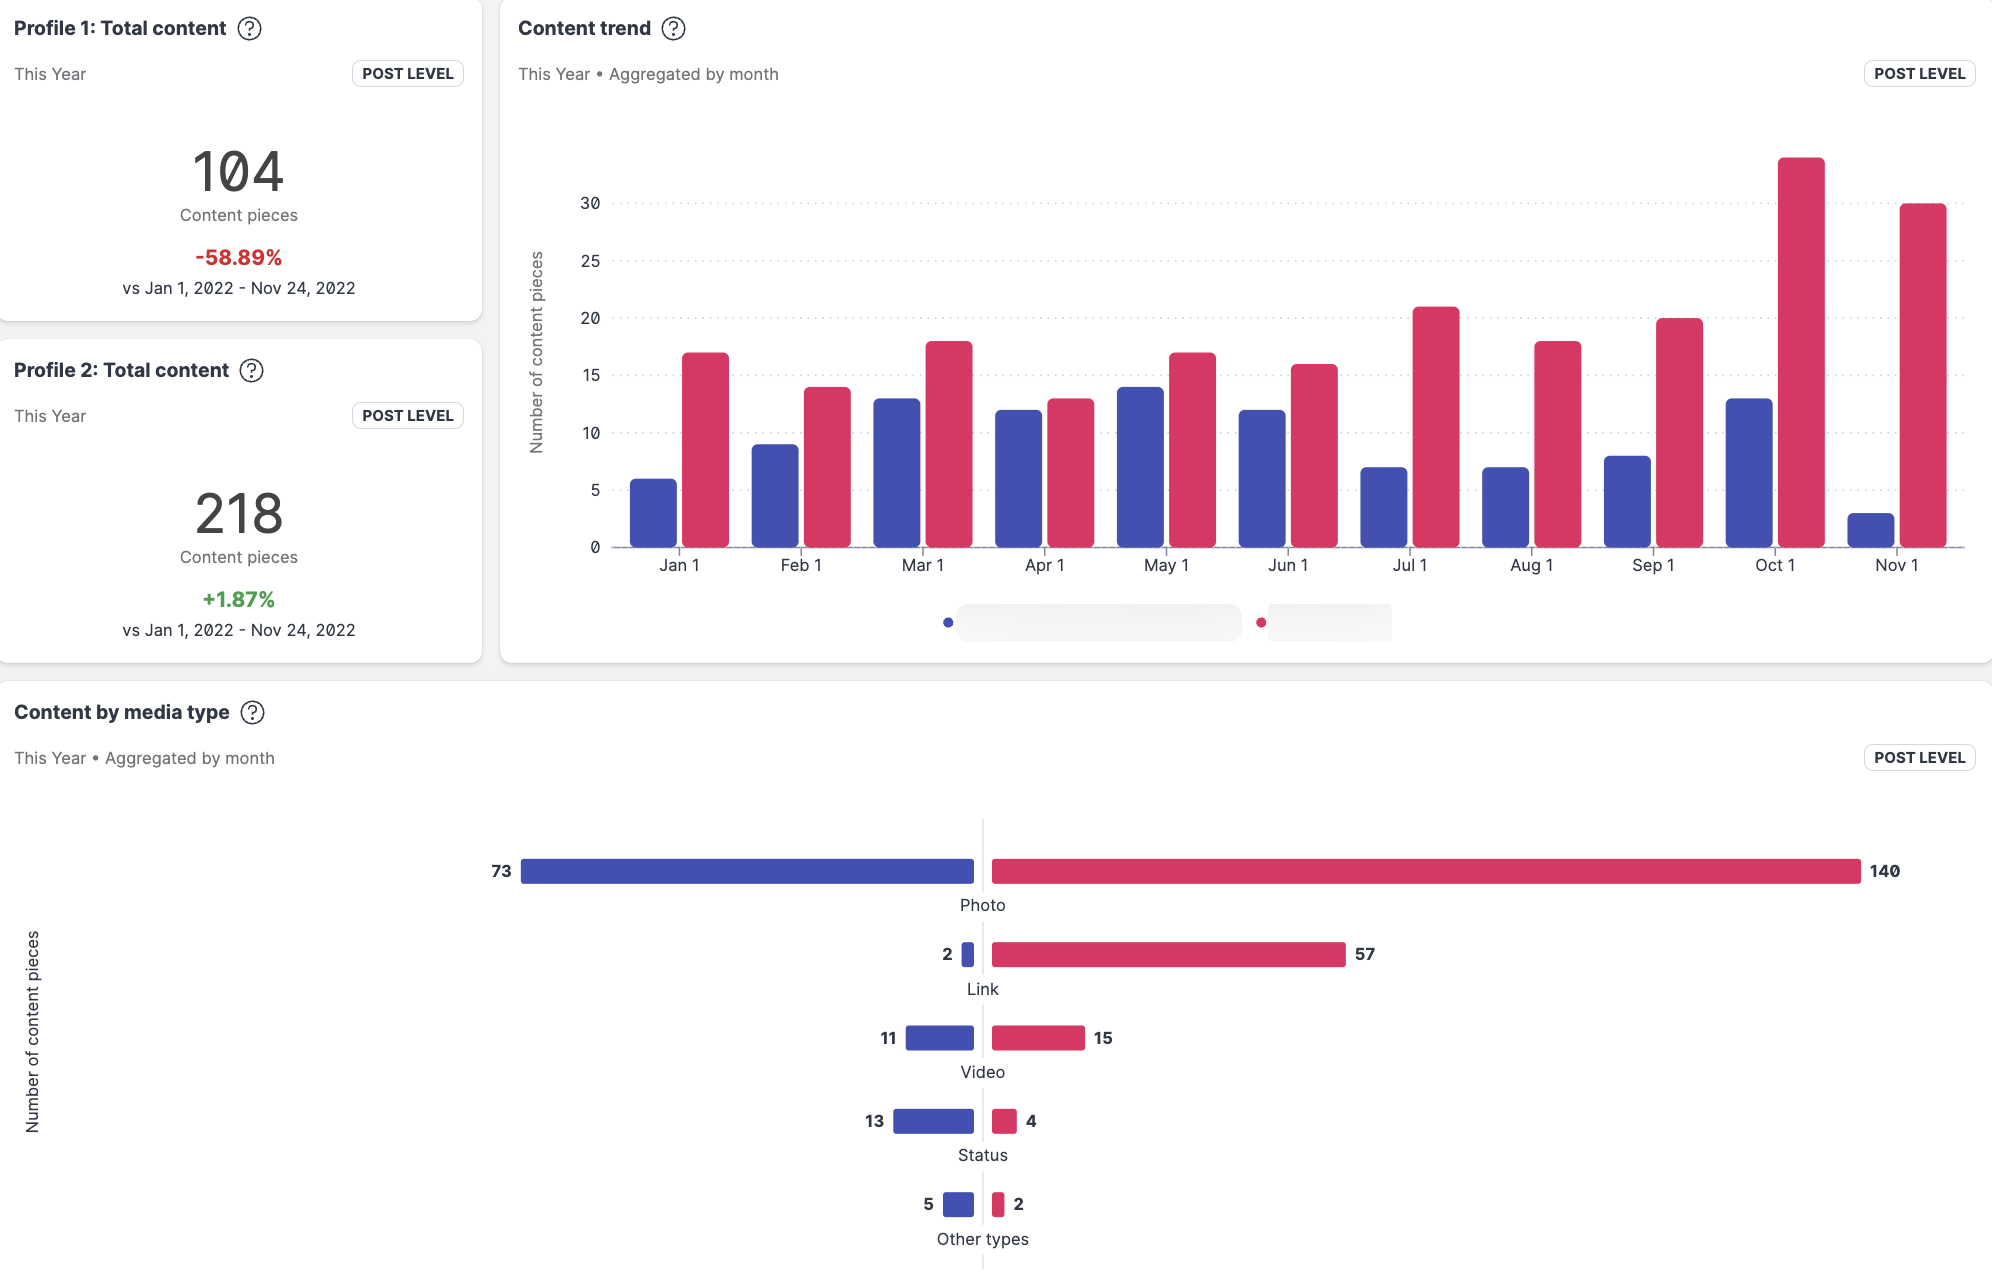
Profile versus Profile comparison offers a head to head overview of two profiles.
The following modes are supported:
comparing profiles from a single platform
crossplatform comparison

To compare two profiles from one platform, follow these steps:
Go to the Profile performance section.
Select the specific platform or click Cross-platform.
Click Overview.
Click the Profile vs. profile tab.
Select the two profiles that you want to compare.
 You can customize the colors of the charts for each of the selected two profiles.
A head-to-head comparison of the selected profiles displays.
Available visualizations and widgets depend on the social platform.
Multicomparison
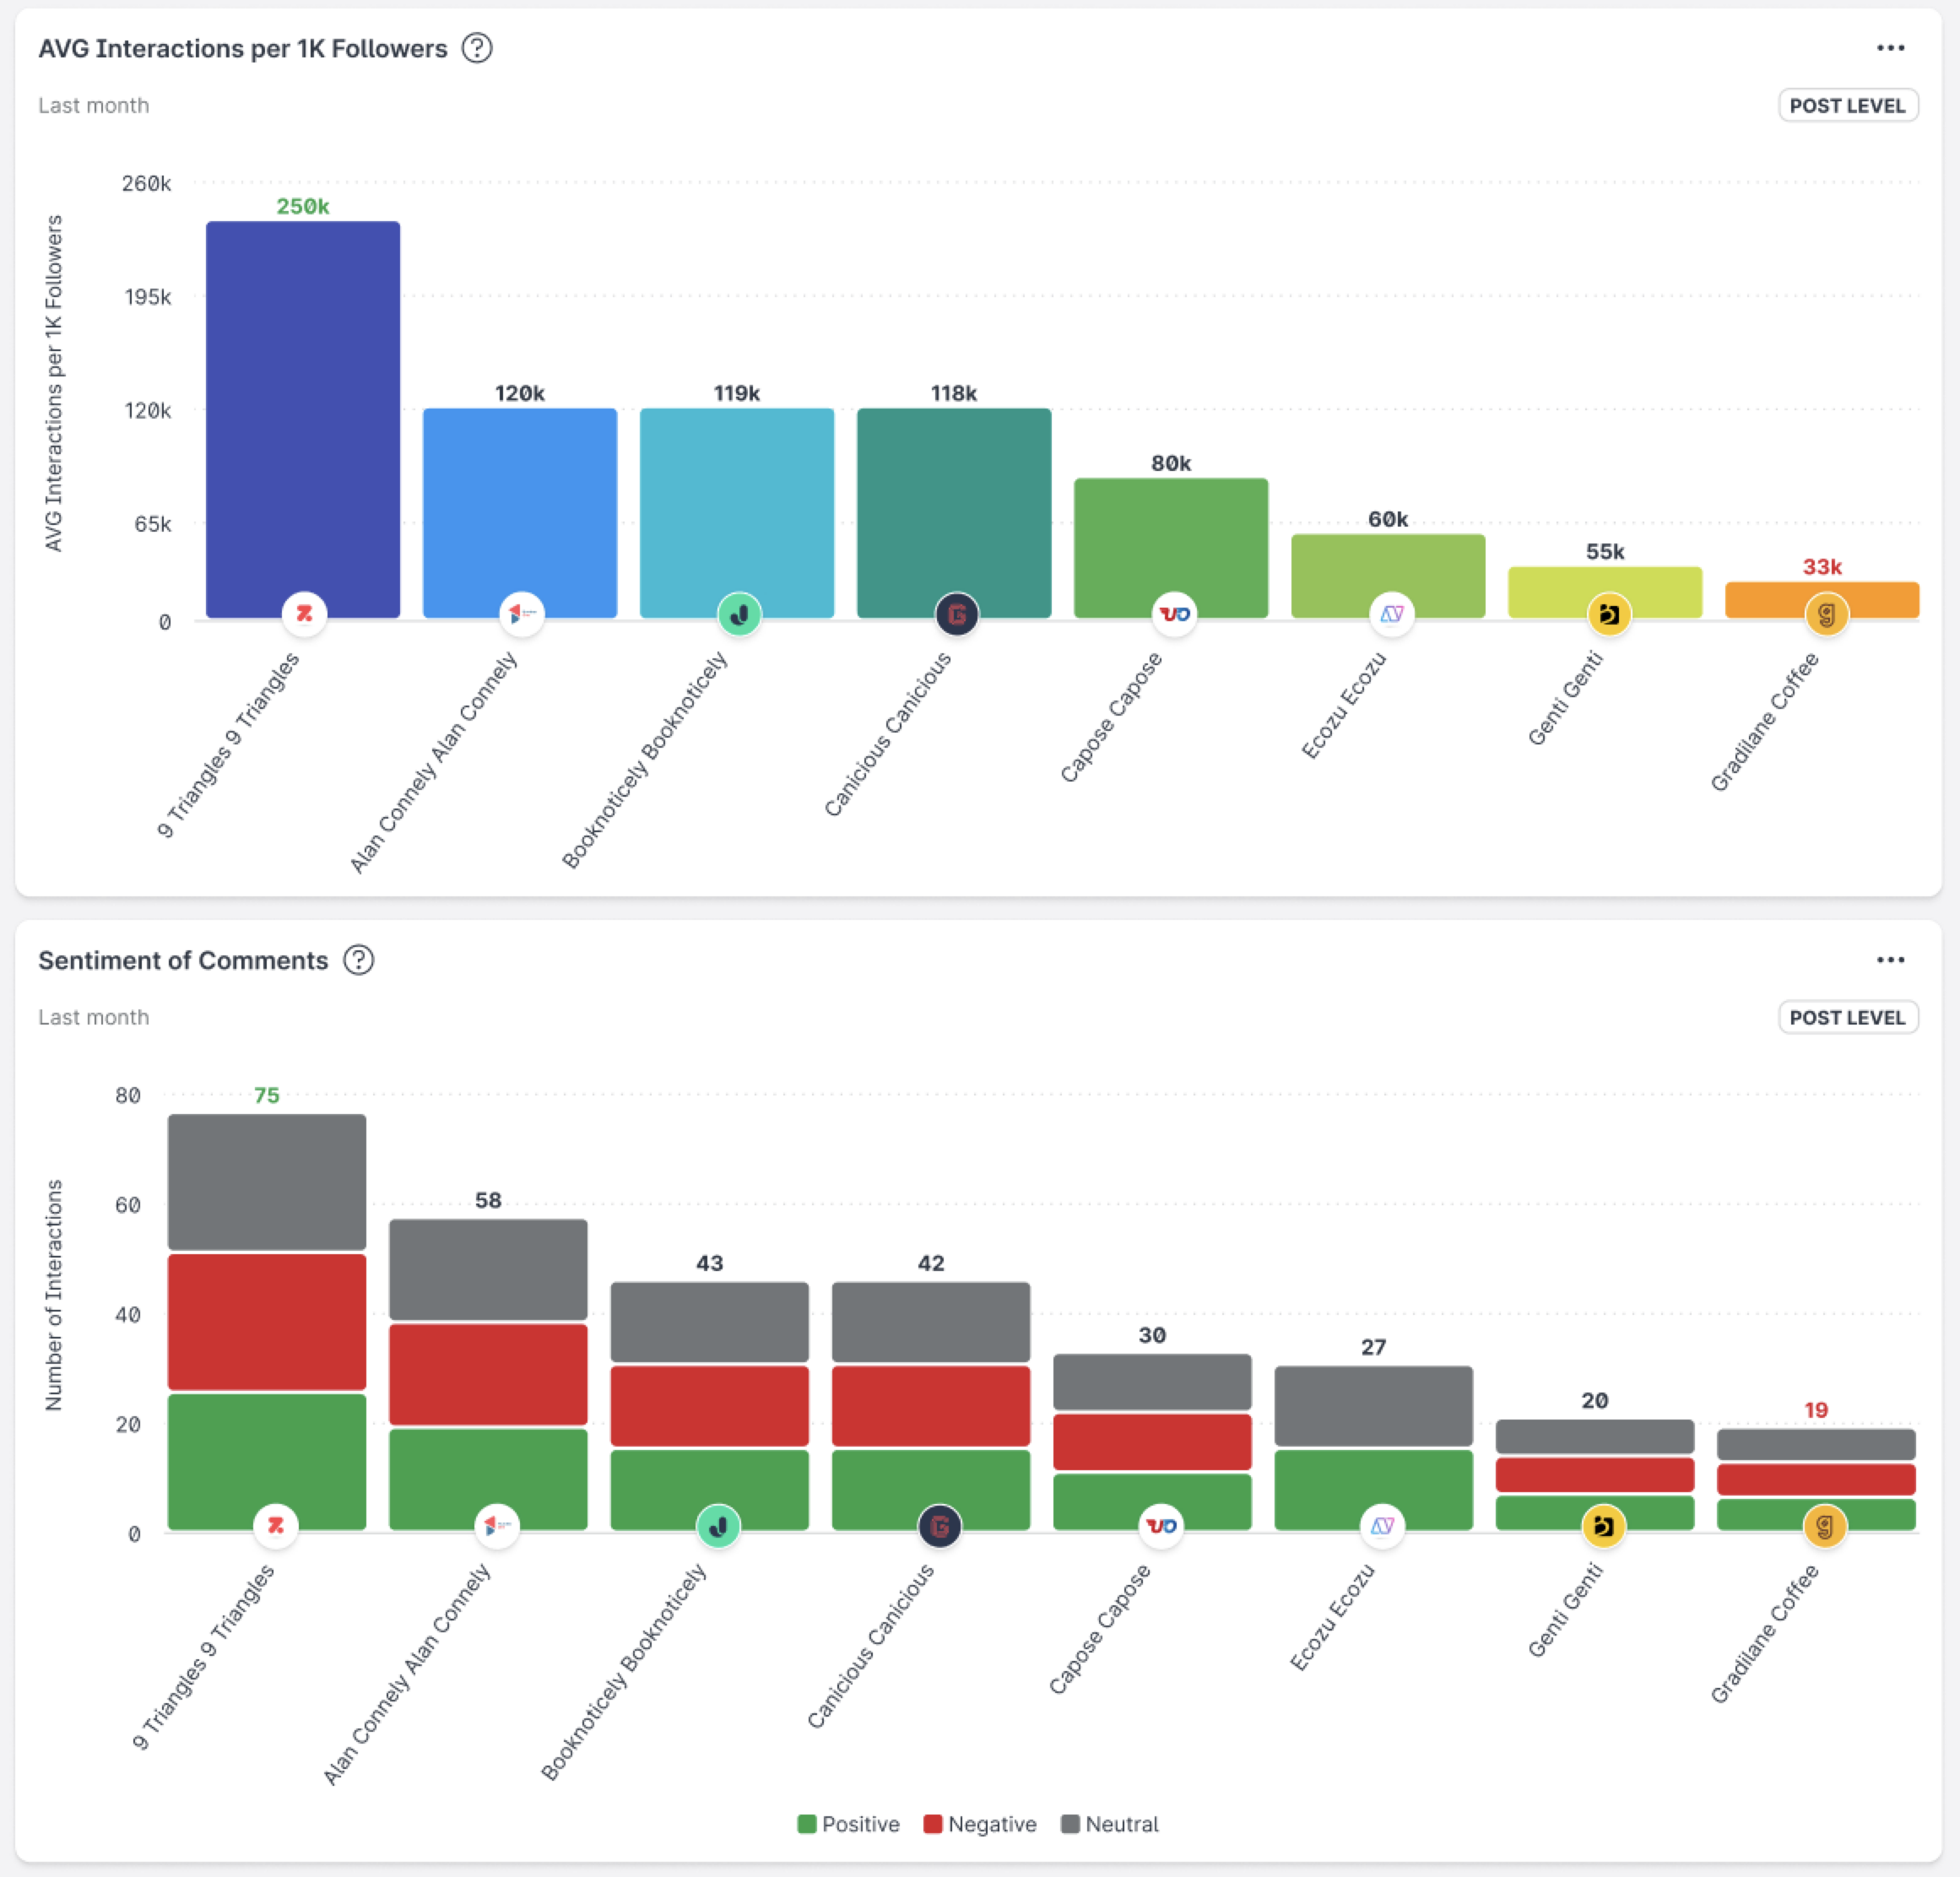
Multicomparison allows you to compare key performance figures of up to 16 profiles across multiple platforms.

To compare multiple profiles, follow these steps:
Go to the Profile performance section.
Select the specific platform or click Cross-platform.
Click Overview.
Click the Multicomparison tab.
Select the two profiles that you want to compare.
 Visualization colors for individual profiles are determined by your settings. To define the colors of individual profiles, see Customize the Properties of a Profile.
You can compare more than 16 profiles. The first 16 are displayed as individual visualizations with logos, the remaining profiles are summarized as Others in a gray column.

Available visualizations and widgets depend on the combination of profiles and social platforms.
When to use which comparison methods
In the following scenarios, we look into how a global Brand, with multiple region-based profiles across several social networks, can use individual comparison methods to assess various aspects of the brand’s social media efficiency.
Profile vs. profile
Profile vs Profile comparison allows you to create a detailed insight into, for example, how your Facebook US compares with Facebook Europe.

Multicomparison
With multicomparison feature you can see the differences between several profiles from multiple platforms at once. Depending on the profiles/platforms combination, the view may not be as detailed as a straight head to head comparison of Profile vs Profile.
Aggregated comparison
Imagine that your brand has the following accounts.
Instagram Europe
Instagram US
Instagram South America
Facebook Europe
Facebook US
Facebook South America
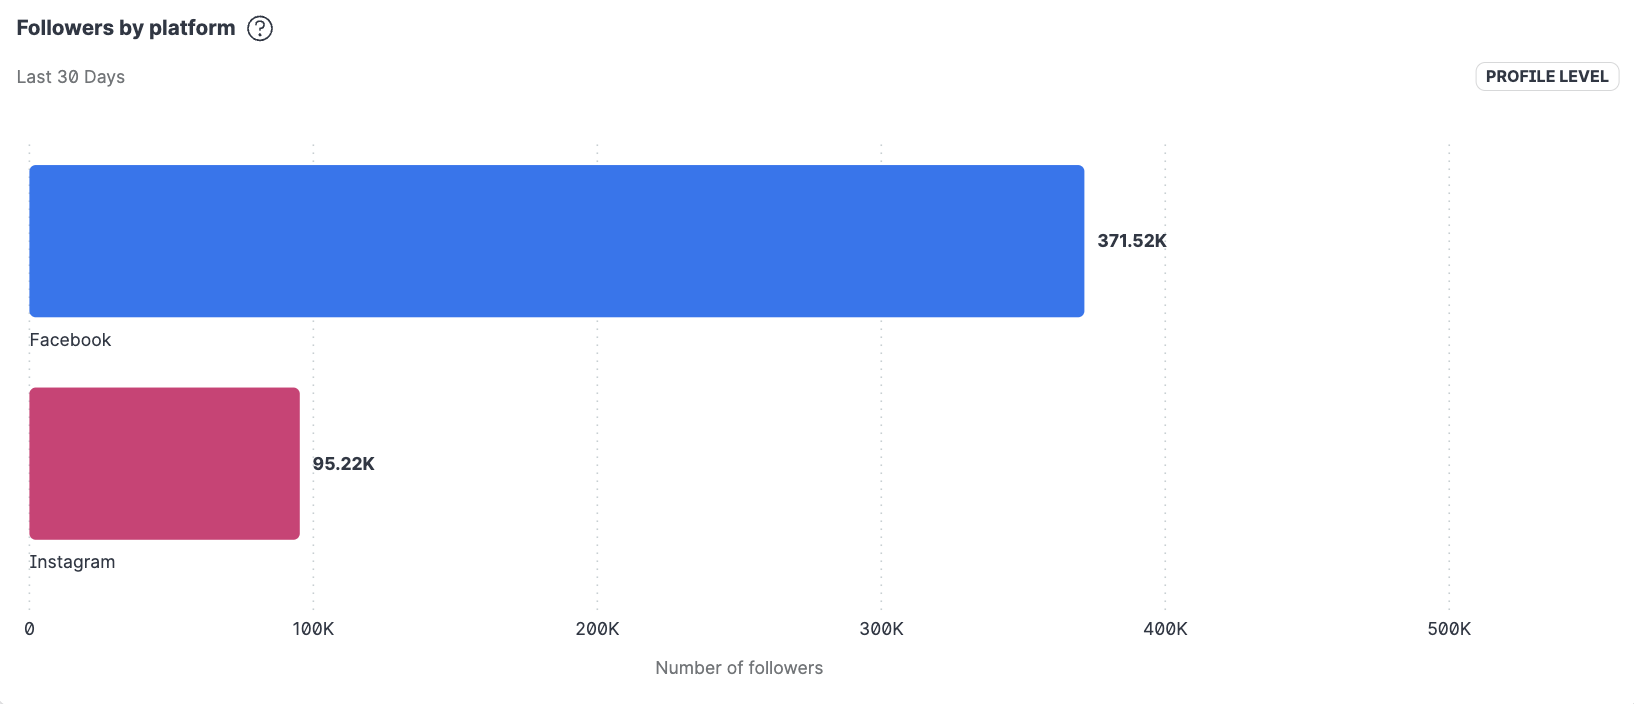
If you select those profiles as data sources for your Cross-platform Overview board in, comparison data will be aggregated across profiles per the network.

Compare your local Facebook pages
If your Facebook account was transitioned to the new page experience (NPE), some metrics are limited to analyzed data from global pages only (for example, followers).
However, the Facebook Profile insights board allows you to analyze and compare local Facebook pages using a page like metric.
That means that you can analyze the performance of your regional Facebook presence (local Facebook profiles) independently from a global Facebook profile.
You can use the following types of comparisons:
Time-comparison
Profile vs Profile
Multi-comparison
