Community comes with its own analytics that provides comprehensive data on agent-customer interaction.
Set up Community dashboards
You can easily review and analyze the performance of your Community operations by creating a dashboard with a set of dedicated Community widgets and metrics.
Generate a Community dashboard from a predefined template
Quickly generate a dashboard with one of ready-to-use Community dashboard templates.
-
Community: Labels & Sentiment
Analyze the incoming content by its sentiment and the labels that you applied to it. -
Community: Team Performance
Analyze how your Community team handles incoming messages and get an overview of the agents' performance. -
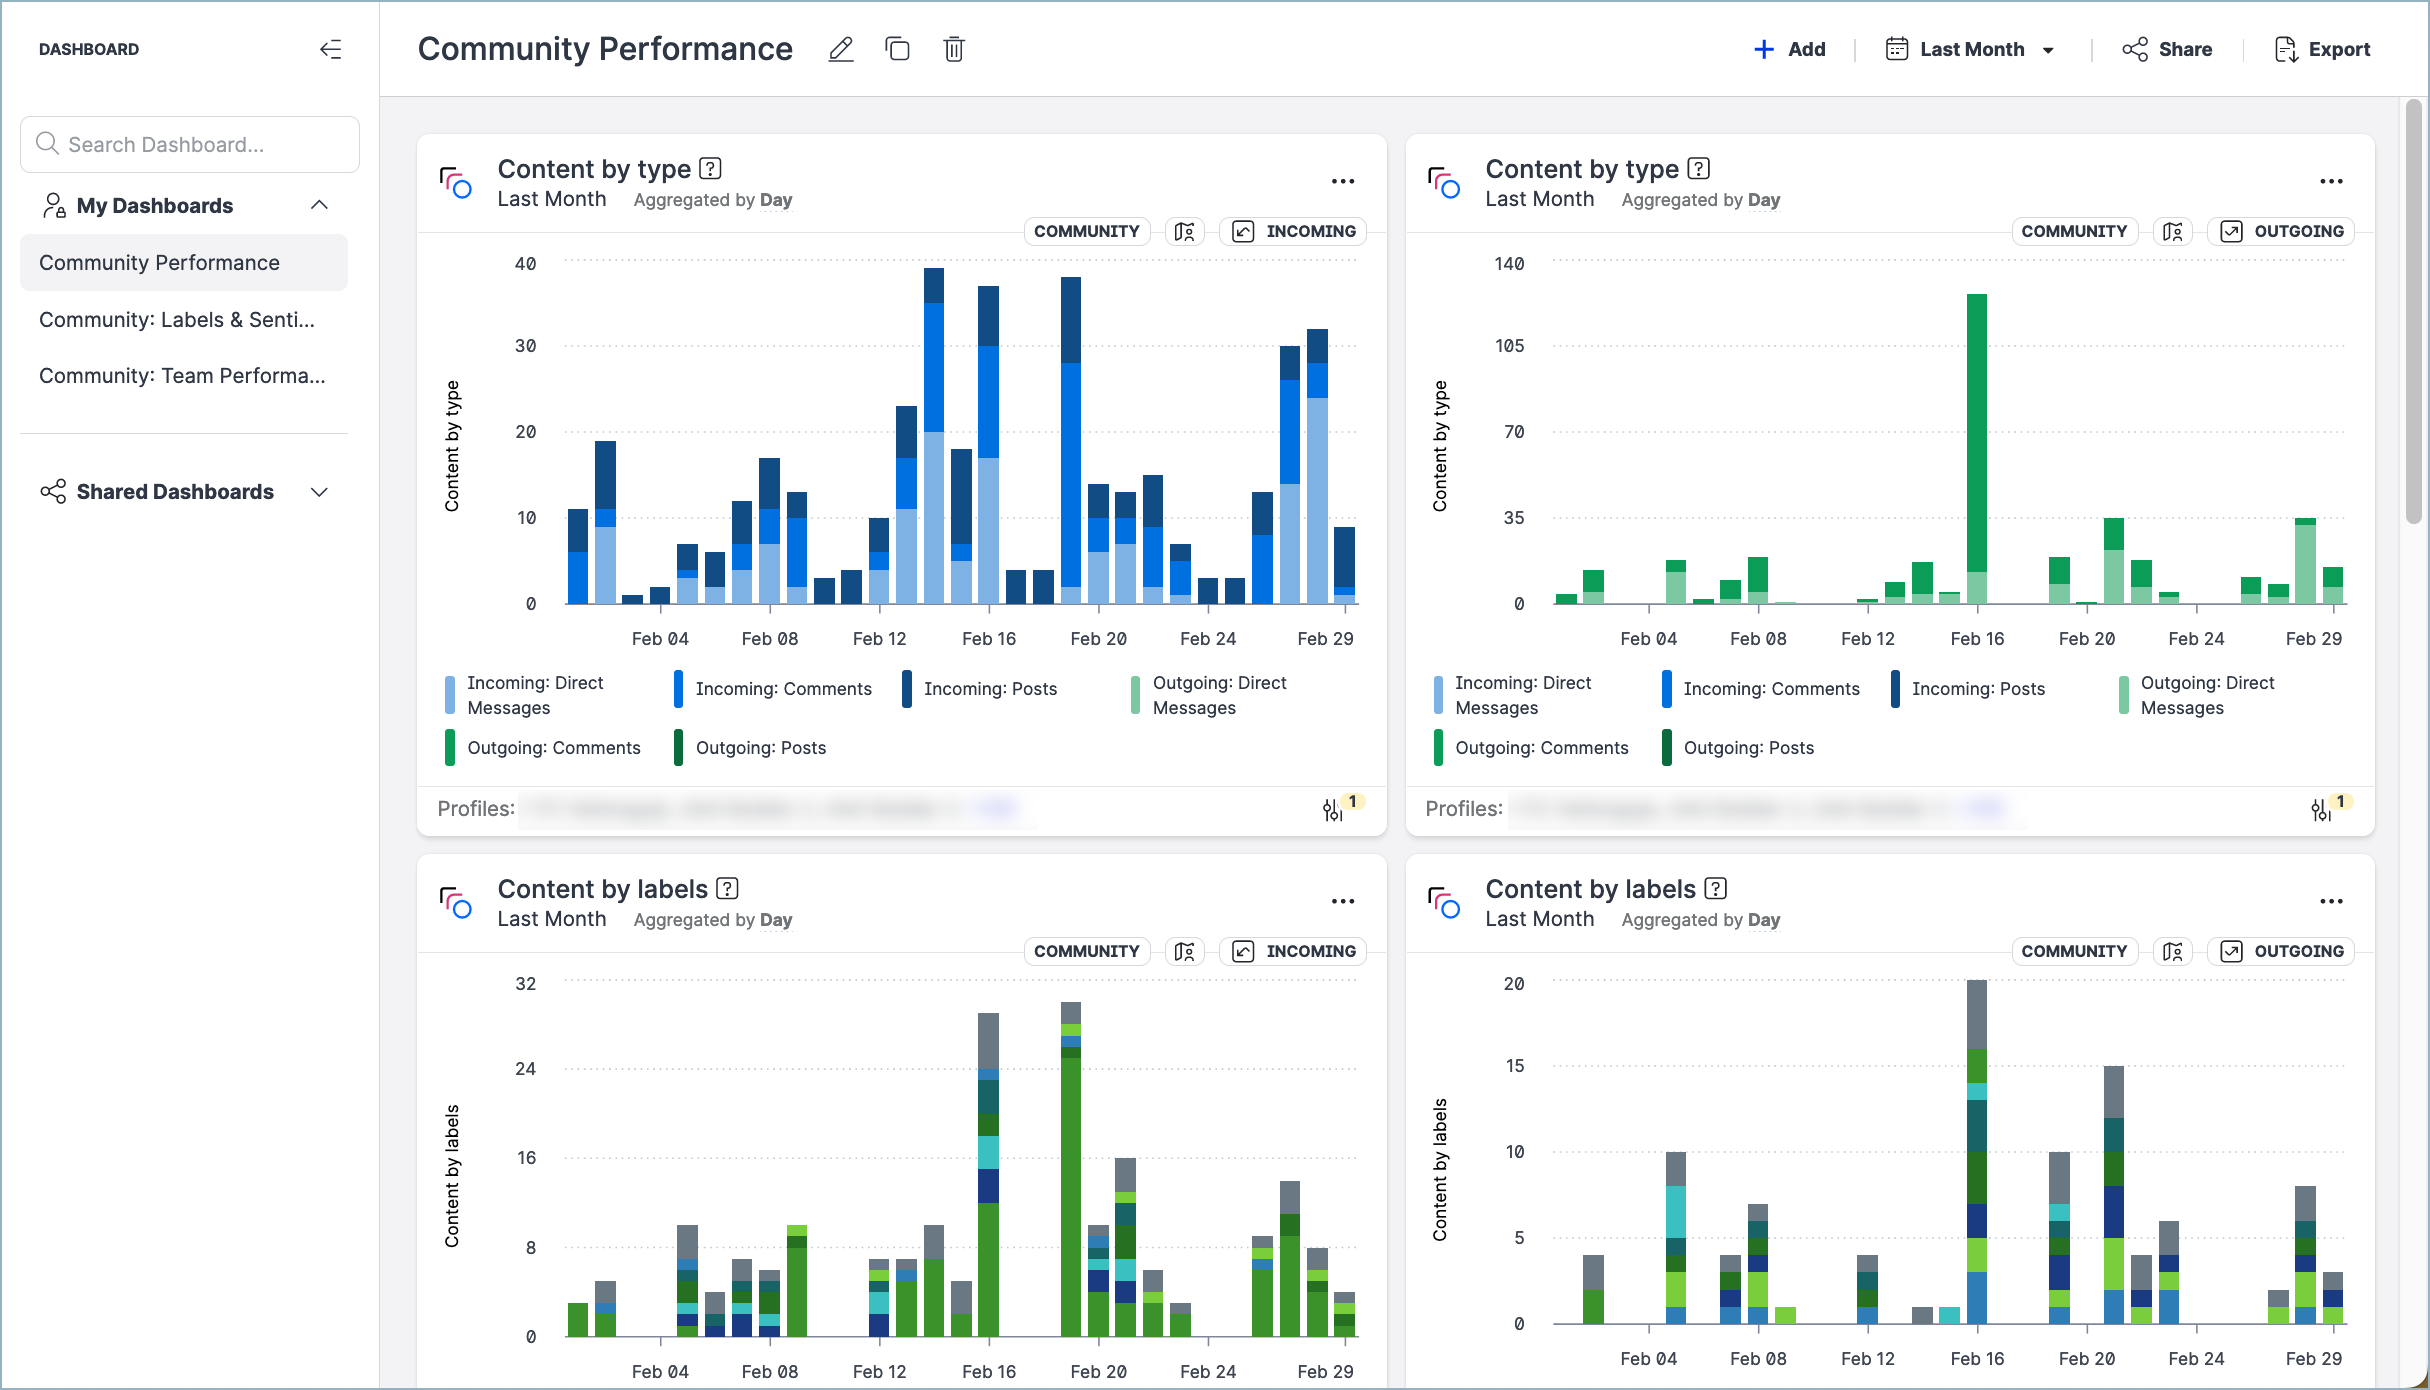
Community Performance
Analyze your incoming and outgoing direct messages to improve your communication over time.
Steps:
-
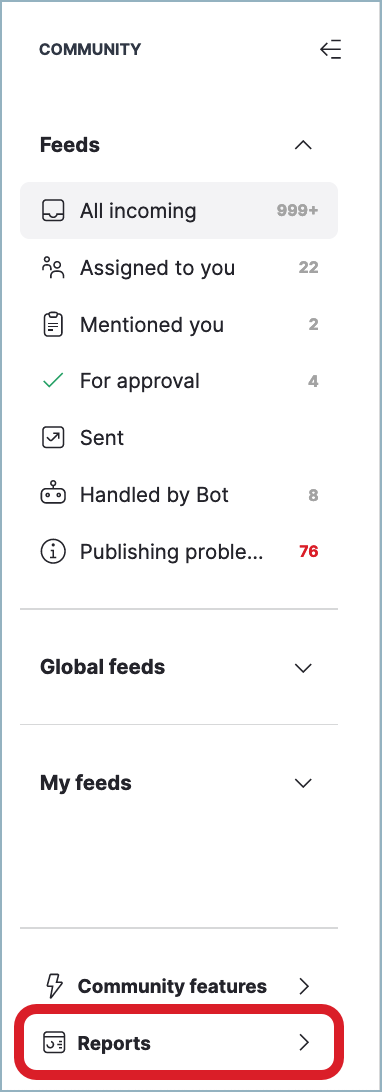
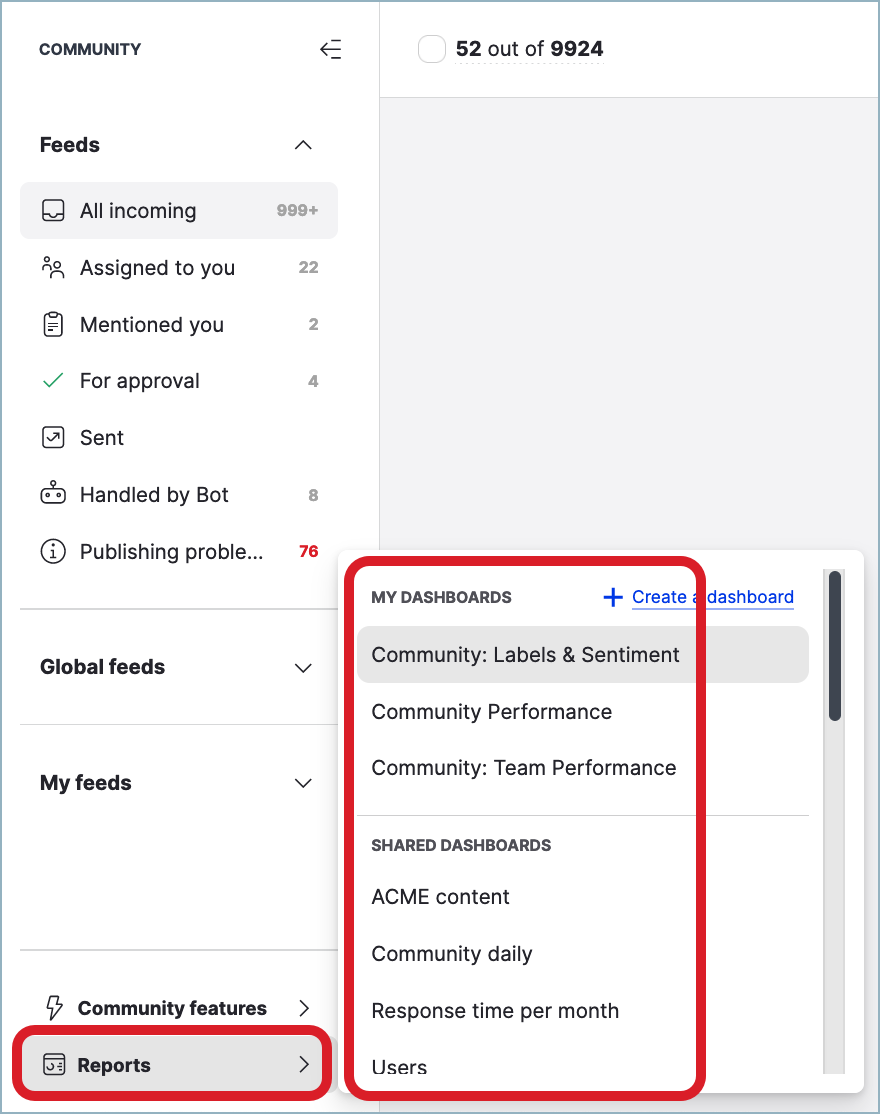
In the main Community menu (see Community Inbox), click Reports -> +Create a dashboard.
You are redirected to the Dashboard module and asked to choose a dashboard template or to start building a dashboard from scratch.
-
Choose one of the Community templates.
A new dashboard is generated and opens. -
Click Select data source, and select the content that you want to analyze.
The dashboard is populated with your Community data. -
(Optional) Rename the dashboard and/or set up the default date range for the dashboard widgets.
-
Click Create Dashboard.
The generated dashboard is saved and appears under My dashboards in the left panel.
The dashboard also appears in Community: you can find it under Reports -> My dashboards in the main Community menu.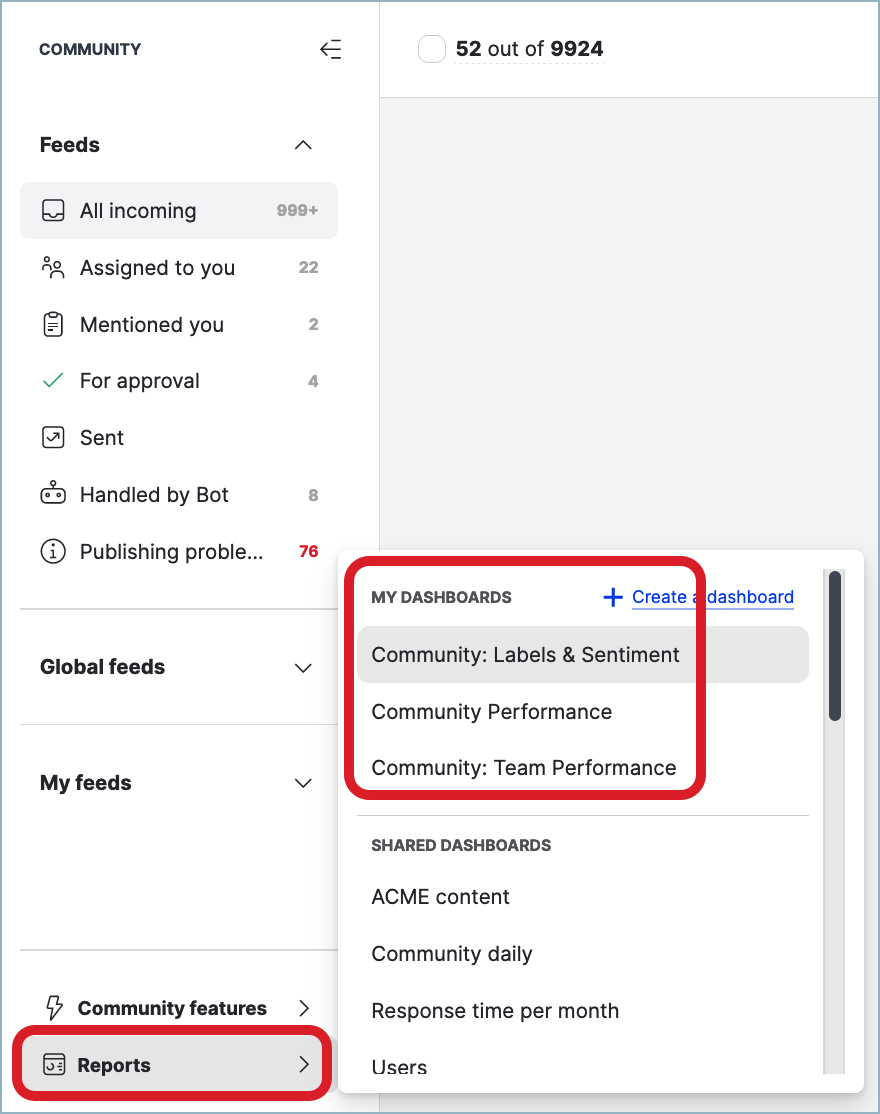
By default, a newly created dashboard is available to you only. You can grant other team members access to the dashboard or export it to PDF and share the generated file (see Share and Export a Dashboard).
At any time later, you can update the dashboard by adding and deleting individual widgets (see Add and Remove a Widget from Dashboard).
Generate a Community dashboard from scratch
Generate a fully customized dashboard with dedicated Community widgets.
You can choose from the following Community widgets:
-
Content by labels
The widget displays the number of posts, comments, and direct conversations that each content label has. -
Content by type
The widget displays the number of incoming posts, outgoing posts, comments, and direct messages grouped by either profiles or profile labels. -
Incoming messages
The widget displays the number of all the incoming messages you find in Community: comments, ad comments, mentions, wall posts, and direct conversations (whole conversations, not individual messages in the conversations, are counted). -
Sent messages
The widget displays the number of all the sent messages you find in Community (both the messages sent from Community and the messages sent natively - directly from the social media platform): replies to comments, replies to ad comments, and direct conversations (whole conversations, not individual messages in the conversations, are counted). -
Incoming vs sent messages
The widget displays the number of all the messages you find in Community, incoming and sent (both the messages sent from Community and the messages sent natively - directly from the social media platform): comments, ad comments, replies, mentions, wall posts, and direct conversations (whole conversations, not individual messages in the conversations, are counted). -
Response time
The widget displays the median or average time taken to respond to all incoming messages over the defined date range. -
Direct messages response time
The widget displays the median or average time taken to respond to a direct message over the defined date range. -
Sentiment of direct messages
The widget displays the breakdown of sentiment – positive, negative, or neutral – in direct messages over the defined date range. -
Average review rating (Community)
The widget displays the median or average rating of all reviews collected during the defined time range. -
Agents' performance
The widget displays how much time each agent takes to respond to messages and how many messages they resolve. -
User activity
The widget displays the number of posts, comments, and direct messages sent by a particular user or group. -
Escalated Salesforce cases (Community)
The widget displays the total number of Community messages escalated to Salesforce.
This widget is available only if you have integrated Community with Salesforce (see Integrate Community and Salesforce).
-
Escalated Salesforce leads
The widget displays the number of leads escalated to Salesforce.
-
Sent surveys
The widget displays the number of VoC (Voice of Customer) surveys you have sent and a visual breakdown of results.
-
Answered surveys
The widget displays the number of sent VoC (Voice of Customer) surveys were answered and a visual breakdown of the results.
-
Survey response rate
The widget displays a percentage rate of how often your sent VoC (Voice of Customer) surveys were answered.
-
Overall satisfaction score (OSAT/CSAT)
The widget displays a breakdown of customer satisfaction scores (CSAT) across surveys collected over the defined time range.
You can filter and break down the data in the widgets by various dimensions (such as assigned users, profiles, social media platforms, sentiment, and so on).
Steps:
-
In the main Community menu (see Community Inbox), click Reports -> +Create a dashboard.
You are redirected to the Dashboard module and asked to choose a dashboard template or to start building a dashboard from scratch.
-
Click Blank Dashboard.
A new empty dashboard opens. In the left panel, a new item titled “Blank Dashboard” appears under My dashboards. -
Click +Add Widget to add your first widget to the new dashboard.
The list of all available widgets opens. -
Click the Community icon to narrow down the selection to only the Community widgets.
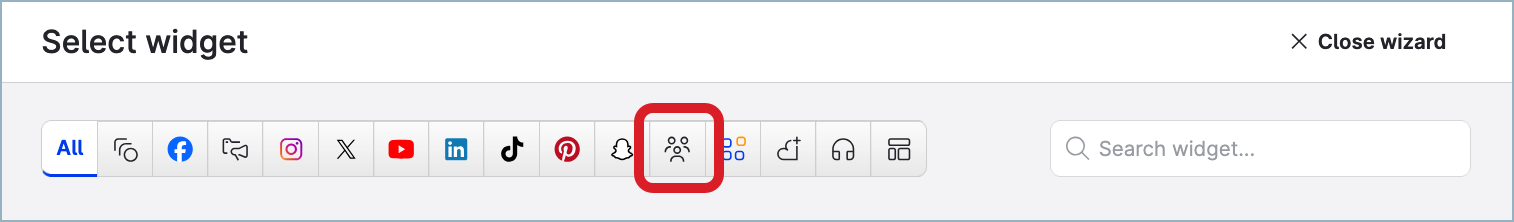
Only Community widgets are displayed.
-
Click the widget that you want to add to the dashboard.
The widget configuration page opens. -
Configure the widget options.
Typically, you can define the widget name, type, data source, filters, breakdown dimensions, and any widget-specific options if available. -
Once you have configured the widget, click Create Widget.
The widget is added to the dashboard. -
To add another widget, click Add -> Widget, and repeat Steps 4-7.
Do so for as many more widgets as you want to add to the dashboard.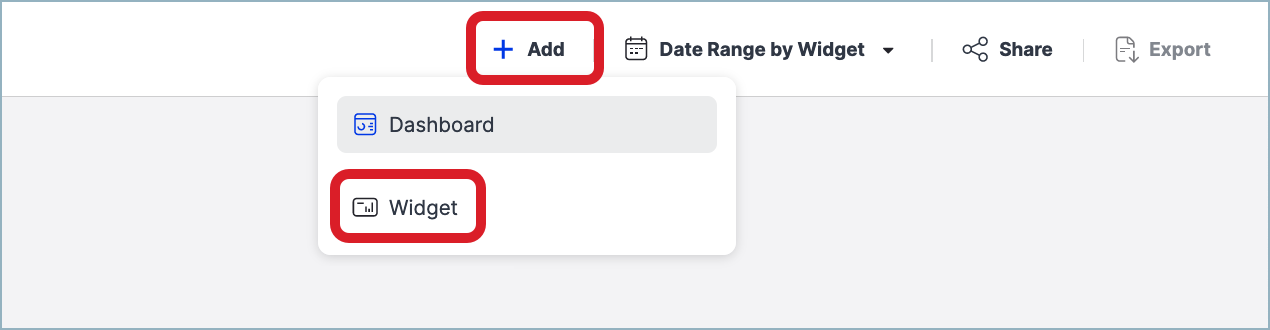
-
Rename the dashboard to give it a distinctive and meaningful name.

Your dashboard is ready.
The dashboard also appears in Community: you can find it under Reports -> My dashboards in the main Community menu.
By default, a newly created dashboard is available to you only. You can grant other team members access to the dashboard or export it to PDF and share the generated file (see Share and Export a Dashboard).
At any time later, you can update the dashboard by adding and deleting individual widgets (see Add and Remove a Widget from Dashboard).
Review the Community dashboards
To see all the Community dashboards that you created or that are shared with you, go to Community, and click Reports in the main Community menu.
Interpreting Community dashboard data
The Community widgets reflect the data that is shown within the Community module, including the following:
-
Content that was sent natively (directly from social media platforms) or using the Emplifi API
-
Care escalation content: the piece of content that was escalated from Community to Care, and the content that was generated by the customer and the Care agents within the scope of the Care case
Listening mentions are not included in the data of the Community widgets.
For more information about what each widget includes in its calculations, see the descriptions of the individual widgets in Widgets Dictionary - Dashboard and the widget tooltips directly in Dashboard.
Measure the average response time of your Community team
The Community analytics allows you to report on the average time taken to respond to your fans' direct messages. You can compare the response time of individual members of the Community team as well as the response time per profile.
To measure and track the average response time, you are going to use the widget Direct messages response time.
Assign business hours to your profiles
Before adding the widget “Direct messages response time” to your dashboard, consider setting up business hours for the profiles that you want to report the response time for.
Business hours are the hours when your Community team is available and able to respond to your fans’ messages (for example, from 8.00 till 17.00 local time). The widget “Direct messages response time” allows you to switch between calculating the average time with or without taking business hours into account.
-
If your Community team is available only during a certain part of the day, you may want to set up business hours to get the most accurate average response time.
-
If your Community team is on duty 24/7 or you are not interested in considering business hours in calculating the response time, you do not need to set business hours, and you can skip this section and proceed with adding the widget to your dashboard (see further in this article).
Community widgets work with business hours assigned to profiles. Assign business hours for each profile that you want to report the response time for. For more information about how to create business hours and then assign them to profiles, see Set Up Business Hours for a Profile or a User and Assign Business Hours to Profiles.
-
When a profile does not have business hours set, the response times displayed in the widget “Direct messages response time” might be much higher than expected because users could be sending messages at night or during holidays or weekends.
-
When a profile has business hours configured, you can configure the widget “Direct messages response time” to take them into account (the timers will be running during the business hours and will pause outside of the business hours and on holidays if any exists).
Setting up or updating business hours are not applied to the widget’s data retrospectively. If you set up or update business hours for a profile, the past response time data will not be recalculated.
Add the widget “Direct messages response time“ to your dashboard
You can add the widget to the dashboard multiple times and configure each instance of the widget to show different aspects of the data.
Steps:
-
Go to Dashboard, and select the dashboard where you want to add the widget.
You can create a new dashboard as described earlier in this article or add the widget to an existing dashboard. -
Click Add -> Widget.
The list of all available widgets opens.
-
Find and click the widget “Direct messages response time”.
The widget configuration page opens. -
Select the data source for the widget to report on.
-
To measure the response time for profiles, select the profiles you would like to report on as your data source. You can select the profiles individually, or you can select one or more profile labels to indicate the profiles to report on.
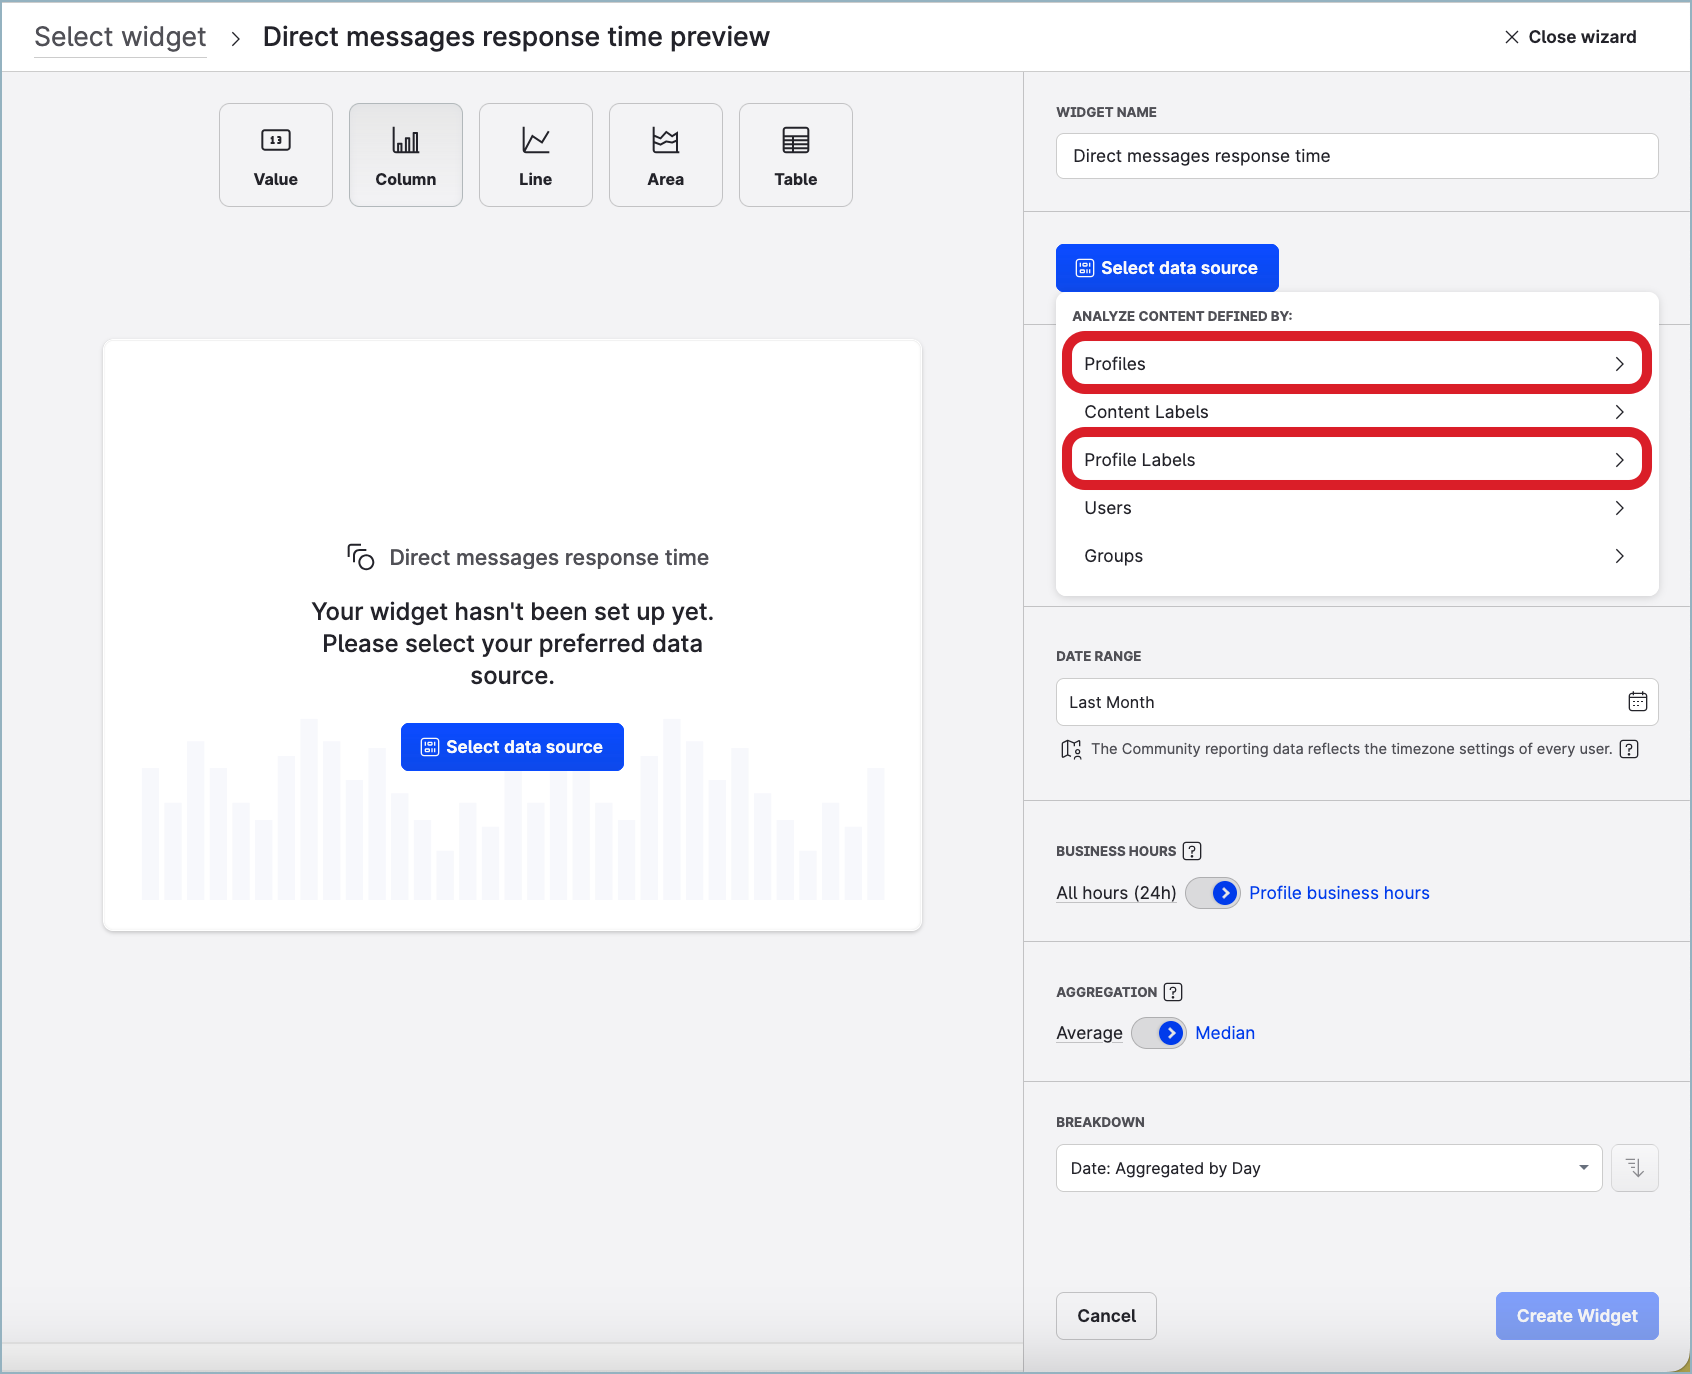
-
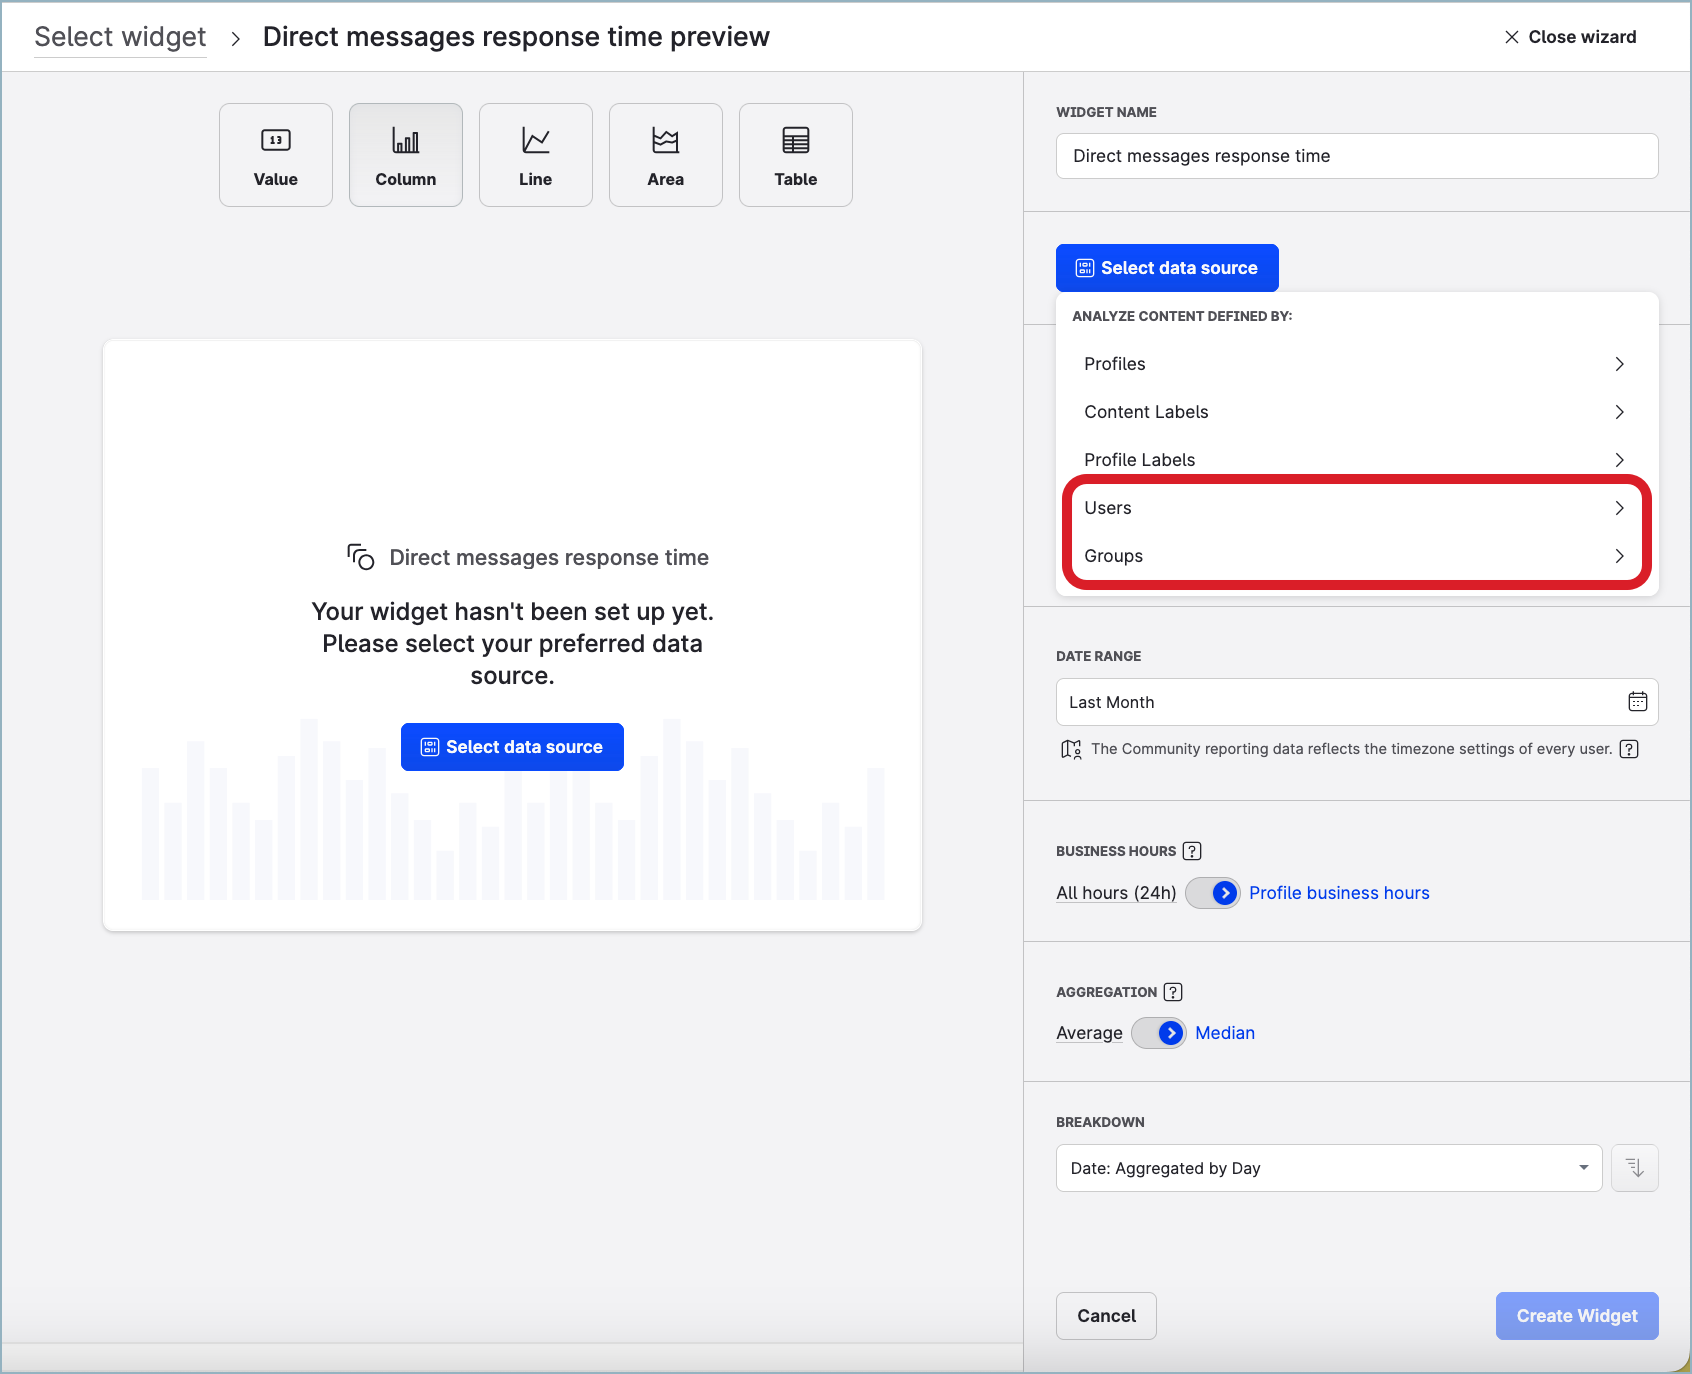
To measure the response time for users, select the users you would like to report on as your data source. You can select the users individually, or you can select one or more user groups to indicate the users to report on. For each selected user, the widget will gather data from all the profiles activated for Community where the user is active.
-
-
Switch the aggregation type from
MediantoAverage.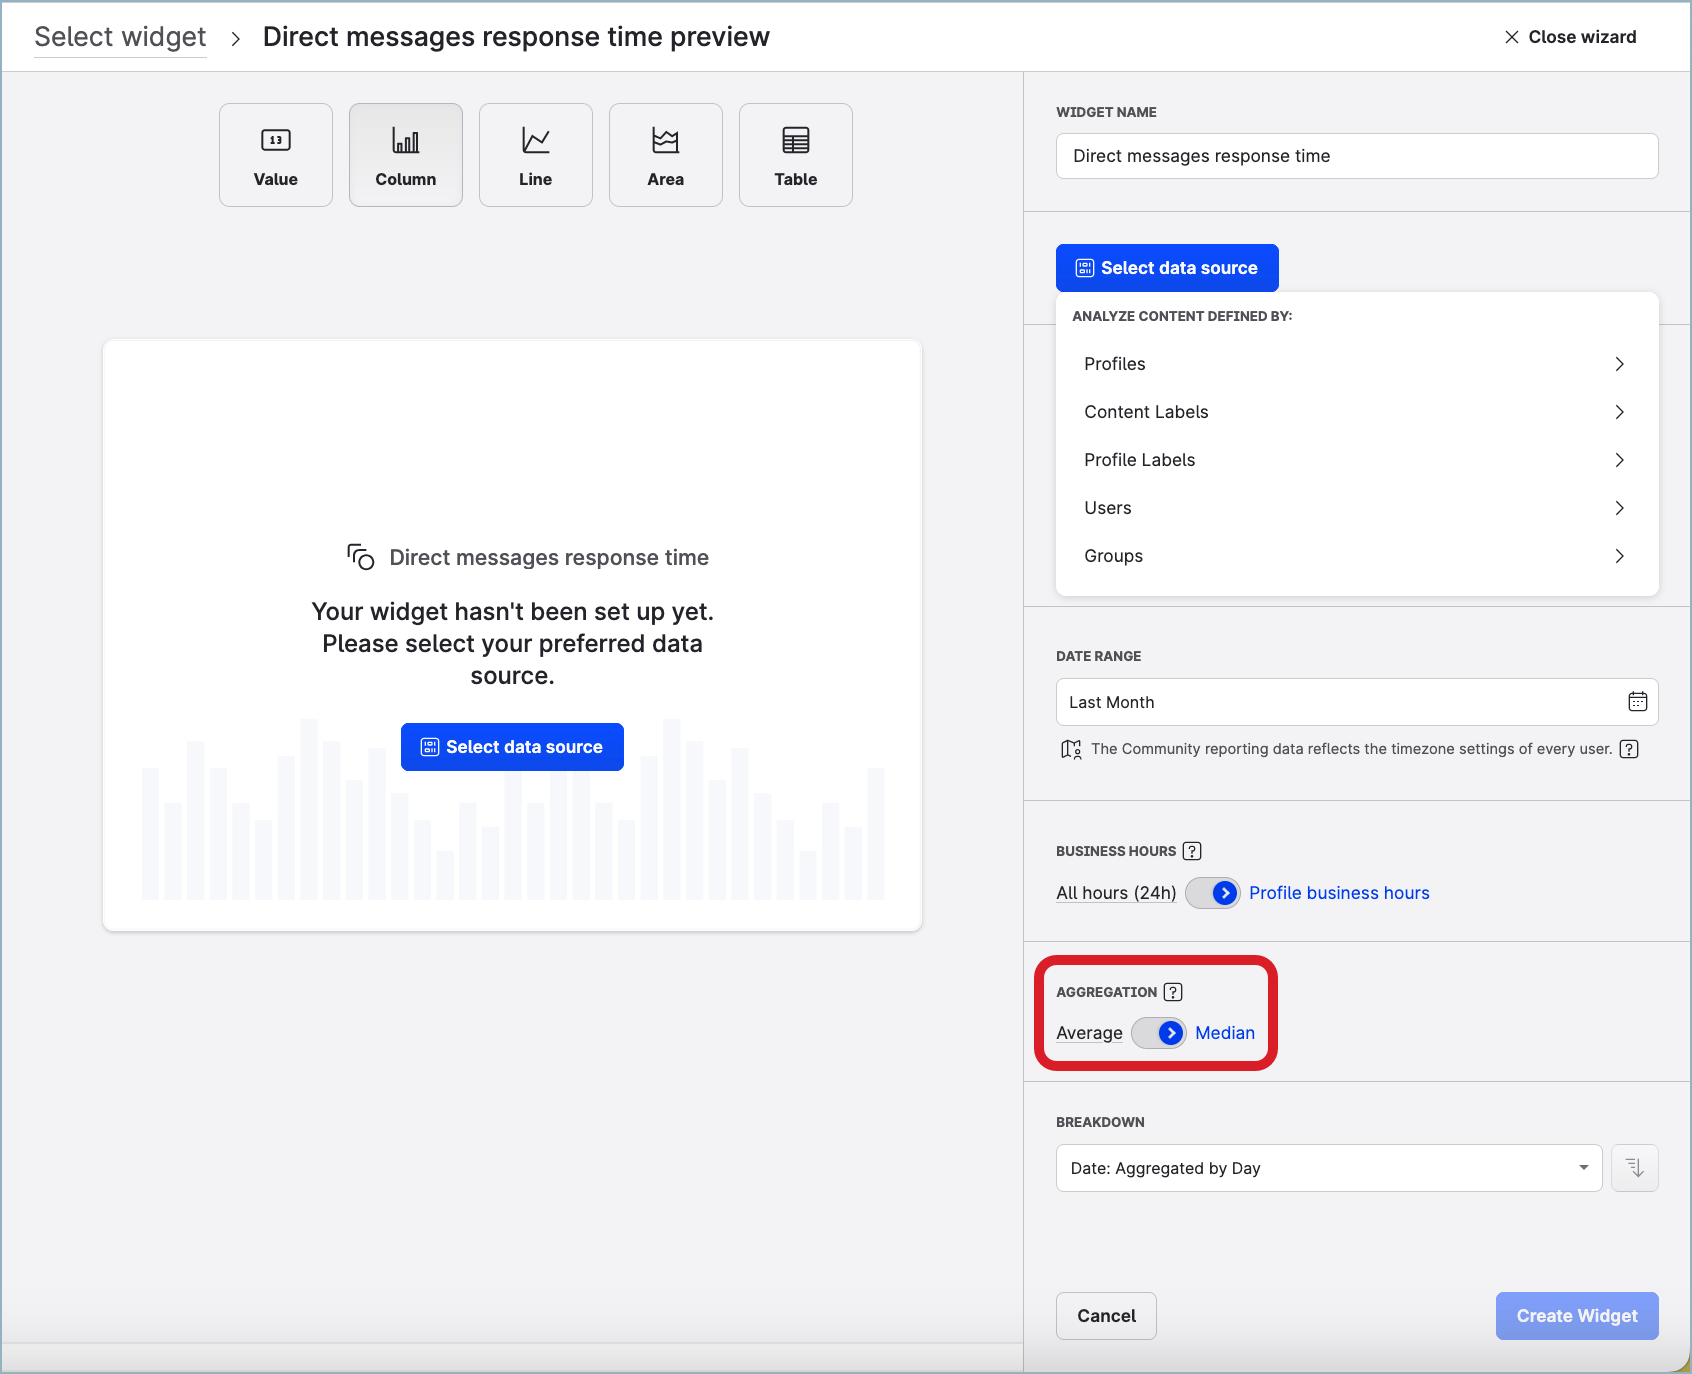
-
To make the widget respect the business hours, switch from
All hours (24h)toProfile business hours.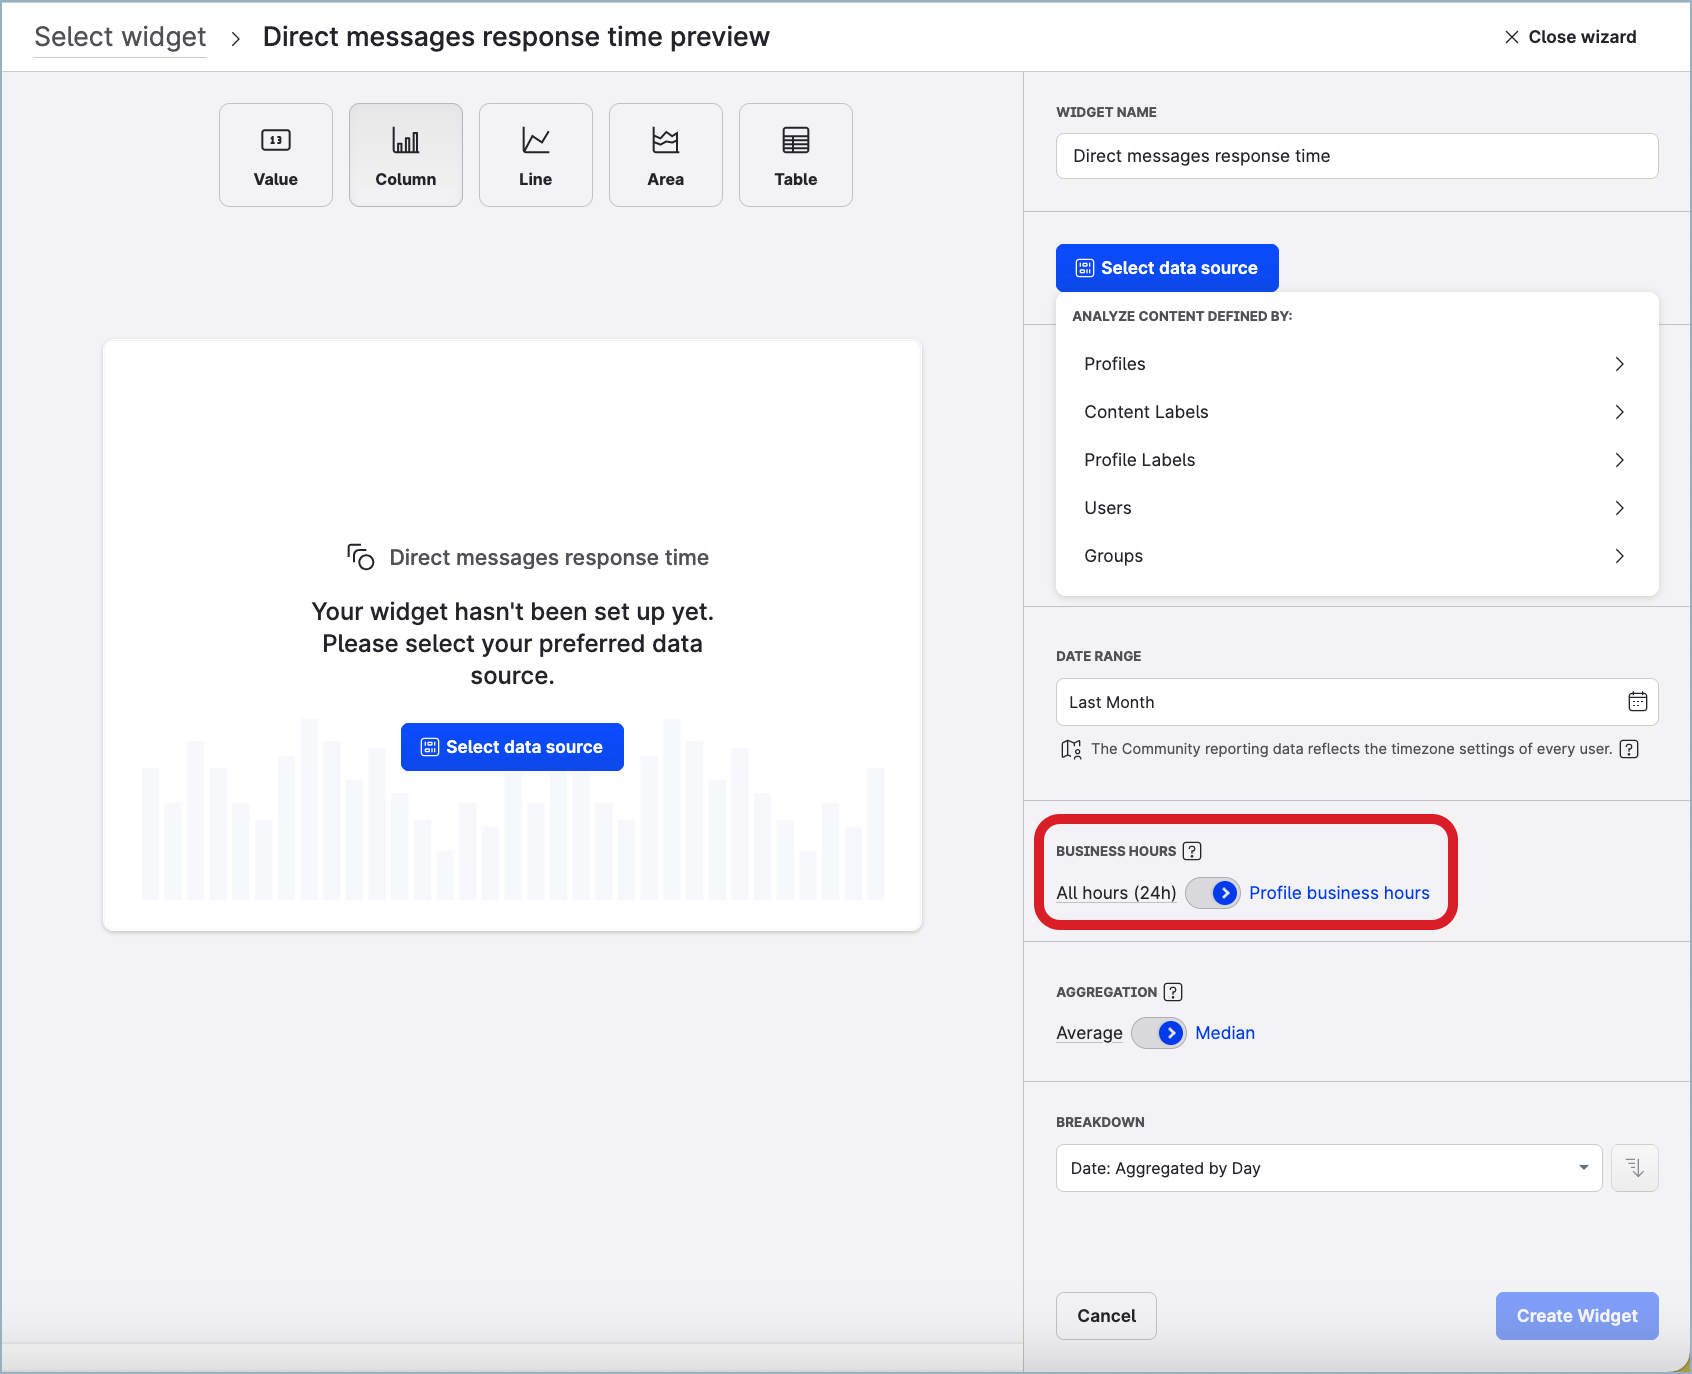
-
(Optional) Configure the other widget options:
-
Choose the type of data visualization (value, column, line, area, or table).
-
Set up the default date range for the widget.
-
Add dimensions to break the data down (platforms, sentiment, and so on).
-
-
Click Create widget.
The widget is added to the dashboard. -
If you want to add another instance of the widget “Direct messages response time” and configure it differently, repeat Steps 2-8 but change the configuration options however you need (for example, you may want to see the average response time with and without business hours taken into account).