Working with Widgets and Metrics in Dashboard
Use the Widget wizard to configure widgets to suit your analytical needs and define the form of the widget’s visualization on the dashboard.
For a comprehensive overview of the widgets and metrics that are available on the in Emplifi Dashboard, see Widgets Dictionary - Dashboard.
If you are using Unified Analytics, see the following sections:
When you open the Widget Wizard, the widgets are displayed with several details to help you choose.
Widget types
Emplifi widgets are, effectively containers for metrics and specific parameters that reach out to your data, do the math and visualize the result in a form of a chart.
You can categorize widget by several ways:
by social network/platform
Some widgets are platform-specific, some work across multiple platforms. This is determined by what data and how individual platforms make data accessible to third party tools.by how they work (how they are applied)
post level
profile level
Emplifi module that they work with
Care
Community
Listening
Paid content
The so-called ‘ads’ widget can process data generated by paid content on individual platforms.
These categories overlap and a single widget can be cross-platform and ads, or post level and cross-platform.
Data visualization
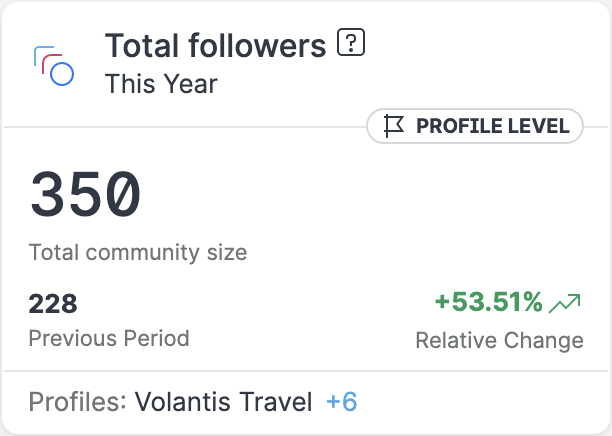
Value
Displays the results of widget’s data processing as a series of numbers.
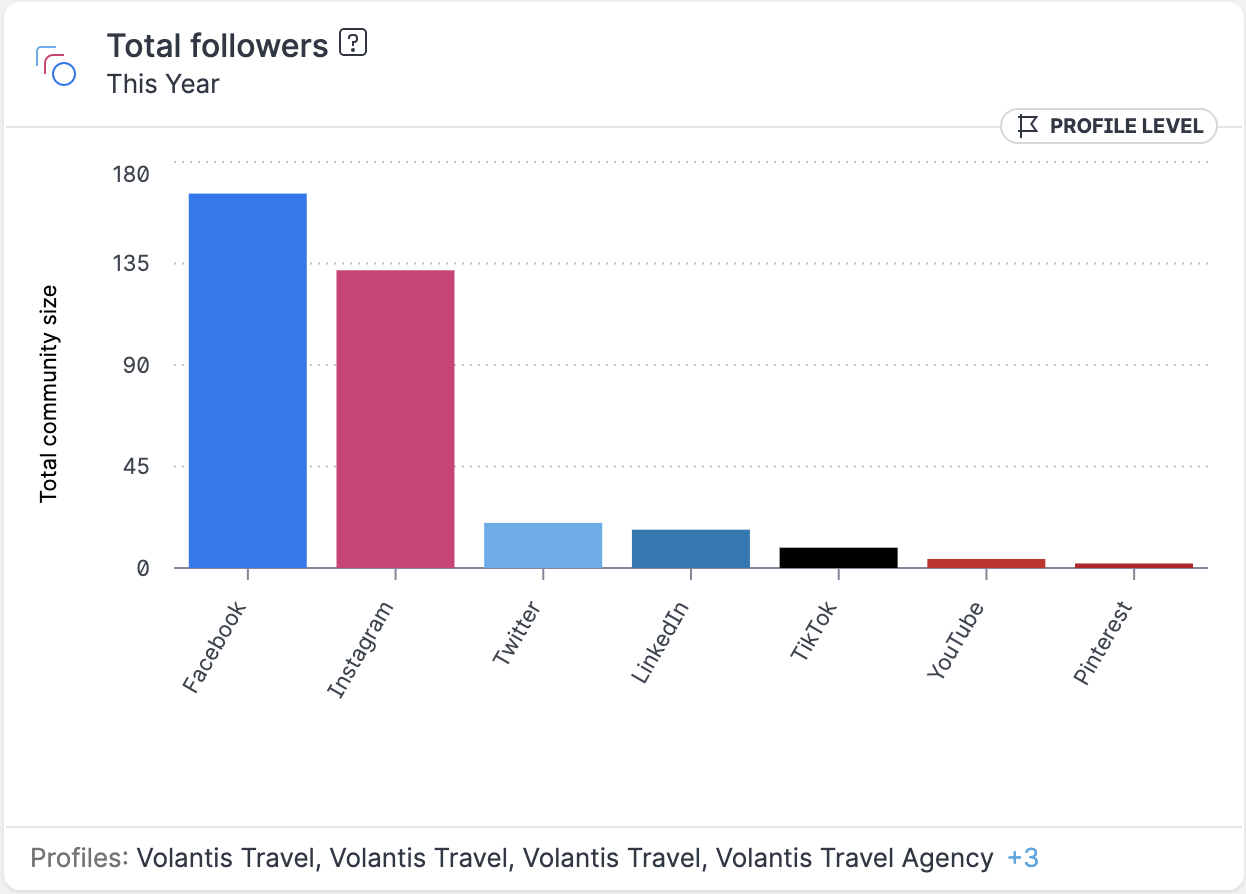
Column
Displays data as a column chart.
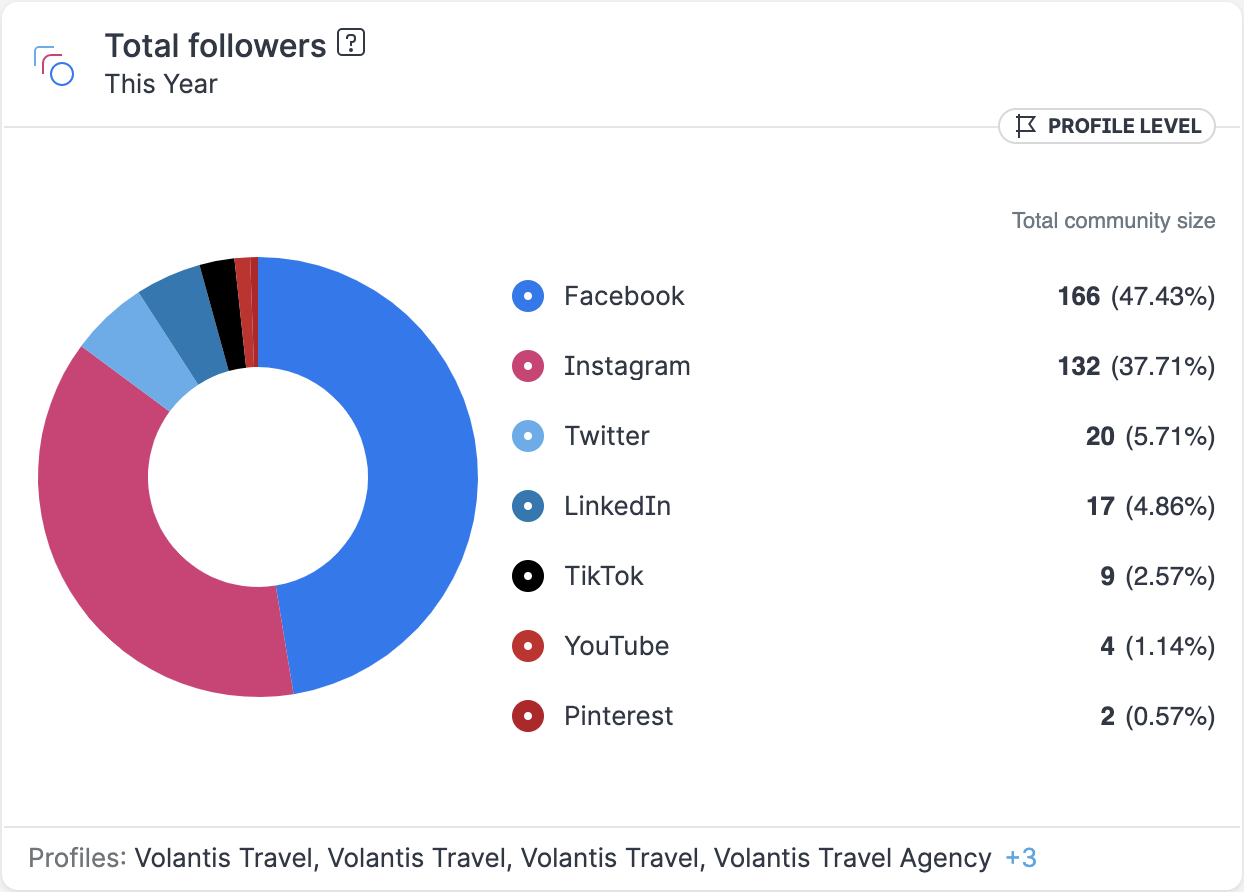
Pie
Displays data as a pie chart.
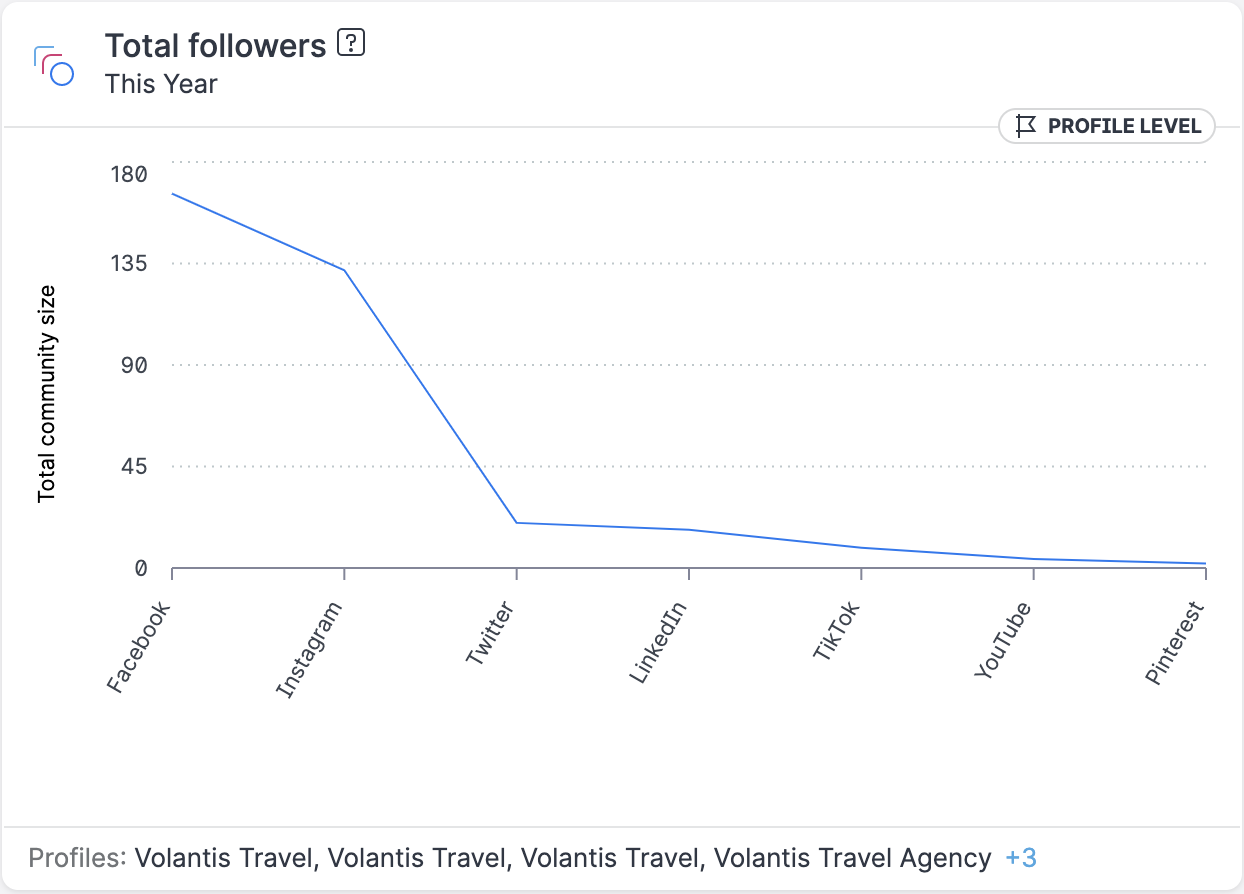
Line
Displays data as a pie chart.
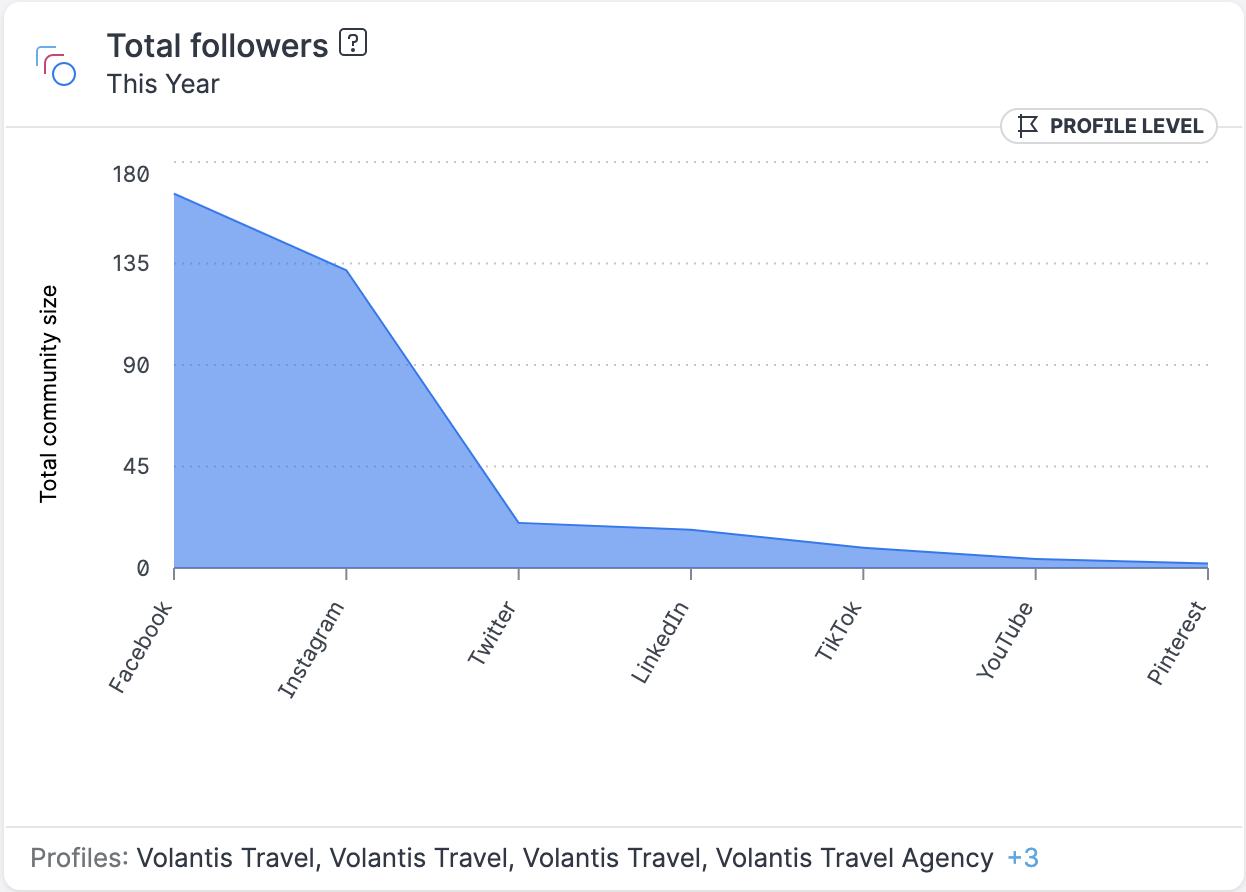
Area
Displays data as an area chart.
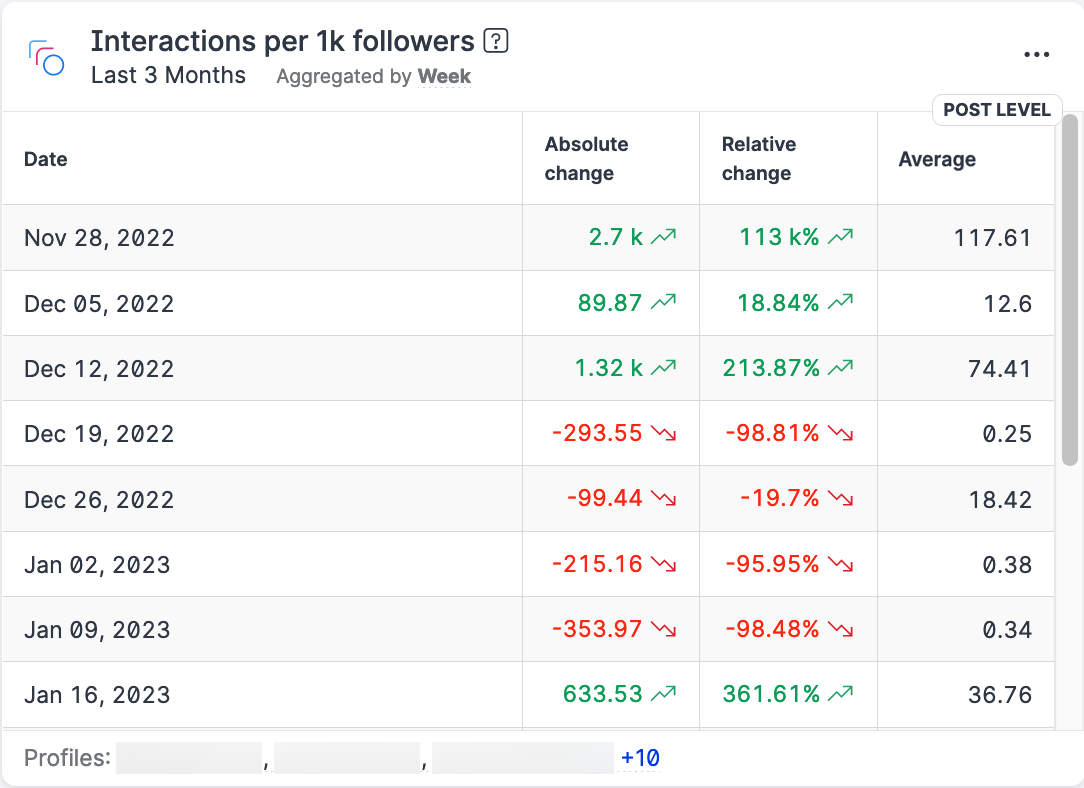
Table
Available only for the Interactions per 1k followers, Direct messages response time, and Response time dashboard widgets
Displays data as a table.