The Snapshot Analytics page provides information on the occurrence of variable values within a set of conversations. You can use this page to filter sets of bot variable values and to view counts and details of conversations in which the used variables match the variable sets specified on this page. For more information, see Variables.
This page is unavailable on the Social Chatbot interface.
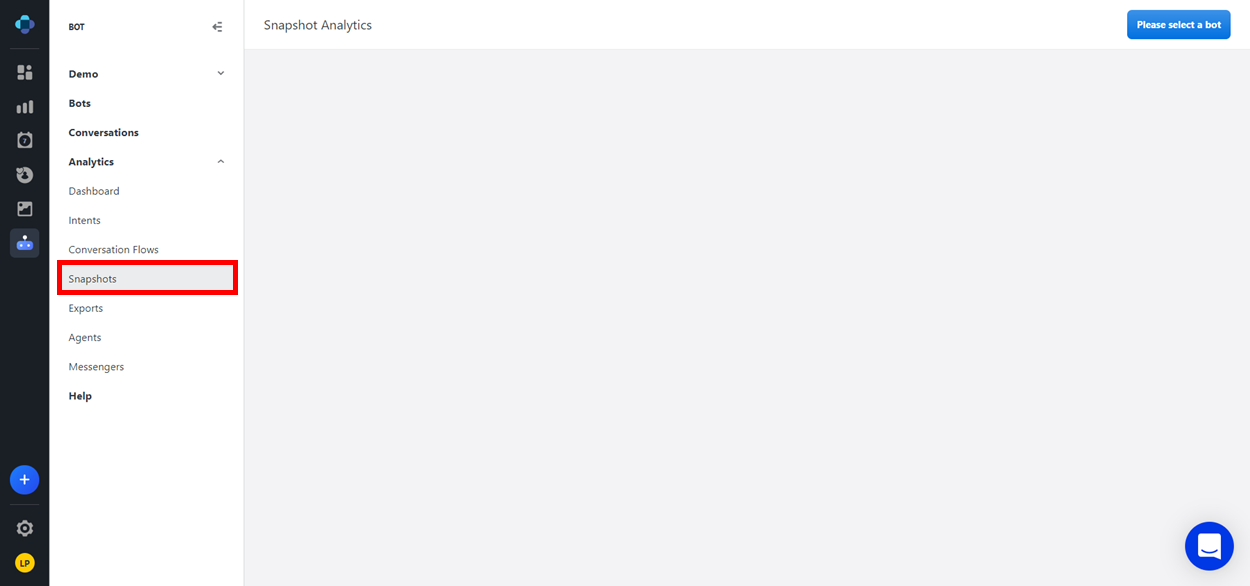
Accessing the Snapshot Analytics Page
-
From the Application Bar, click Analytics.
-
Click Snapshots.
Configuring Snapshot analytics
In order to view snapshot analytics, you must first complete all of the following steps:
-
Configure variables to be included in snapshot reporting.
Only bot variables can be included in snapshot reporting. This option is unavailable for flow variables.
-
Add those variables to your bot on the Bot Authoring page.
-
Configure the widget on the Snapshot Analytics page to display metrics on the variables.
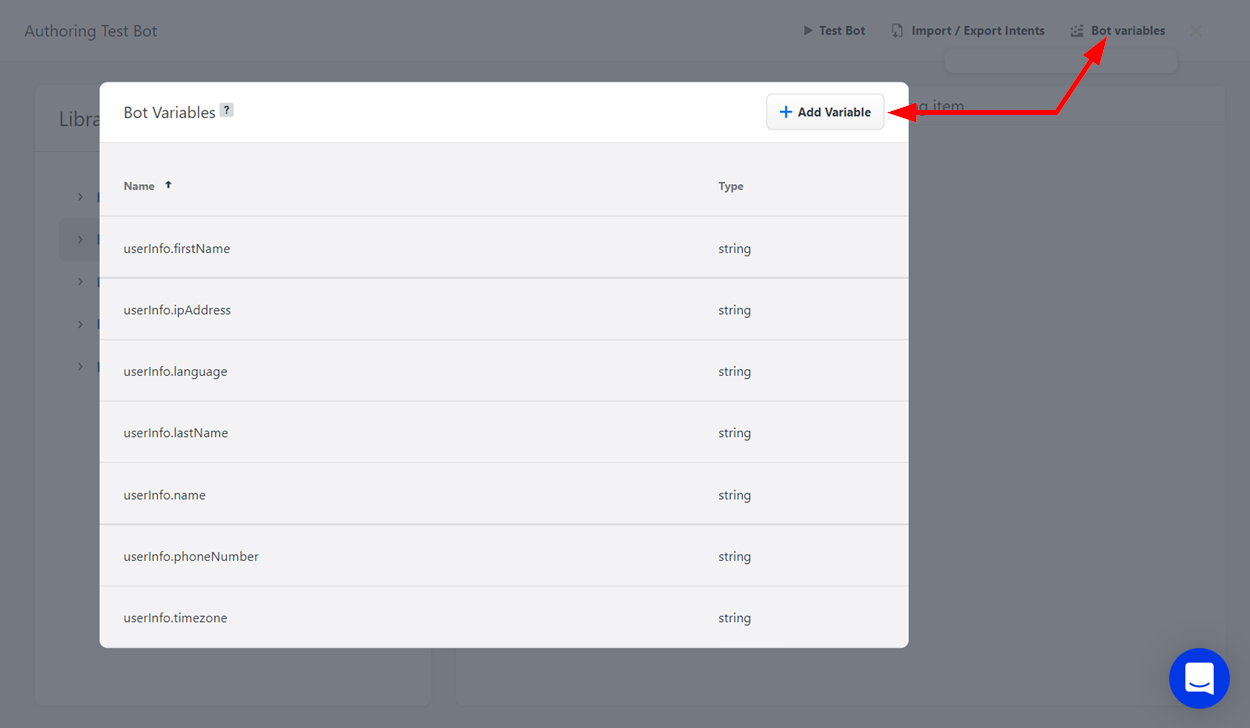
Configuring Bot variables for Snapshot reporting
-
From the top banner of the Bot Authoring page, click the Bot Variables button. The Bot Variables dialog window displays.
-
From the dialog window, click the + Add Variable button. A pop-up window displays.
-
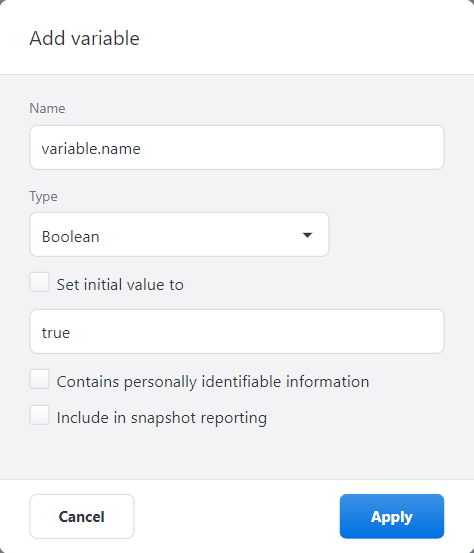
Fill out the relevant fields with the appropriate information. For more information about these fields, see Variables.
-
Include in snapshot reporting: Check this box to include this variable's usage metrics in the snapshot analytics report.
-
-
Click Apply to save the bot variable.
Adding variables to your Bot
-
In the appropriate conversation flow, find the Standard node where your bot will use the user's input to save a value to the variable. For more information about nodes and conversation flows, see Conversation Flows.
-
Click the Standard node to display the Node Menu above it, then click the Node Settings button.
-
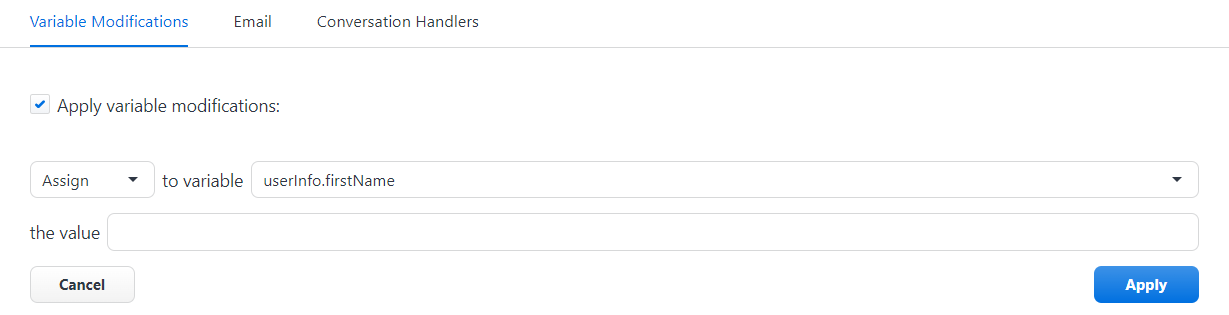
In the Node Settings dialog window, scroll down to the Variable Modifications section. Check the box next to Apply variable modifications.
After checking the box, the Variable Modifications area will darken, indicating that it has become available for editing. -
Click the + Add Modification button to create a new variable modification.
-
Using the drop-down list adjacent to "to variable", choose the variable you would like the user input to save to.
-
In "the value" field, enter the appropriate system variable.
There is a preexisting variable in your system named lastMessage.content, which represents the most recent message that the user has sent your bot. This can be entered here to assign the user input to the variable that you are currently modifying. -
Click Apply.
Configuring Snapshot Reports
-
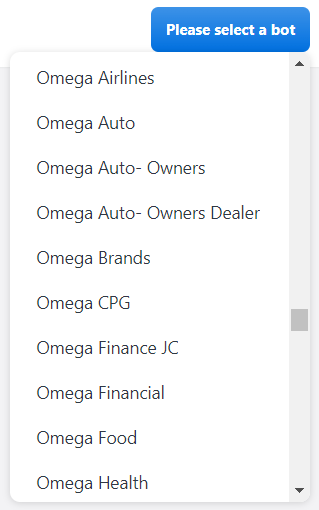
In the upper right corner of the Snapshot Analytics page, click Please select a bot. A drop-down menu appears.
-
Select the Bot that you have added the variable to. An array of empty widgets appears on the screen.
-
On an empty widget, click the Add button to add a snapshot report.
-
On the newly added report, click the Additional Chart Options button . A drop-down menu appears.
-
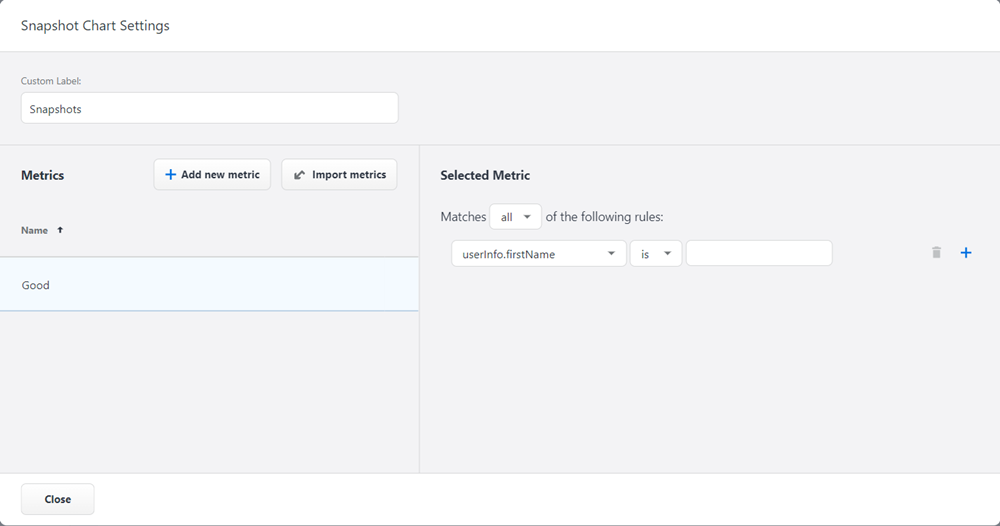
Select Configure from the drop-down menu. The Snapshot Chart Settings window displays.
-
Click the + Add New Metric button to create a new variable metric in the report.
-
Each metric has a rule associated with it, allowing you to customize how the variables are reported.
-
Use the Matches drop-down menu to select how the rule should be followed. Choose from:
-
any to require a match for any of the listed rules.
-
all to require a match for all listed rules.
-
none to require no matches for the listed rules.
-
-
Define the condition by choosing the condition category, the operator, and the value. The operator and value options available to you will change based on the condition category you select. For more information, see the Condition, Value, and Operator table below.
-
-
Optionally, you can click the Publish button next to a metric to make it available to be added to other snapshot reports. Likewise, you can click the Import Metrics button to add a metric that you have previously published from another snapshot report.
-
When you are finished configuring the metrics of the snapshot report, click Close. You changes will save automatically, and the snapshot report will appear in the widget.
Additional buttons
Report date range buttons
On a report, click the Date Range button to choose the date range of the report.
If you select Custom from the drop-down menu, a calendar will appear for you to select a start date and an end date.
-
After you make your selections and click Apply, the report will adjust to display data from this range.
-
Click Clear to reset the calendar.
Additional chart options
On a report, click the Additional Chart Options button to display a drop-down menu.
In addition to the Configure option detailed above, the drop-down menu also contains two other sections.
-
The Organization section, where you can choose how the variable metrics are organized (Overall or By Platform).
-
The Format section, where you can choose how your report is displayed (List, Pie Chart, or Bar Chart).