Once your campaign is running and you are collecting content there are a few places you will be able to view analytics and performance data.
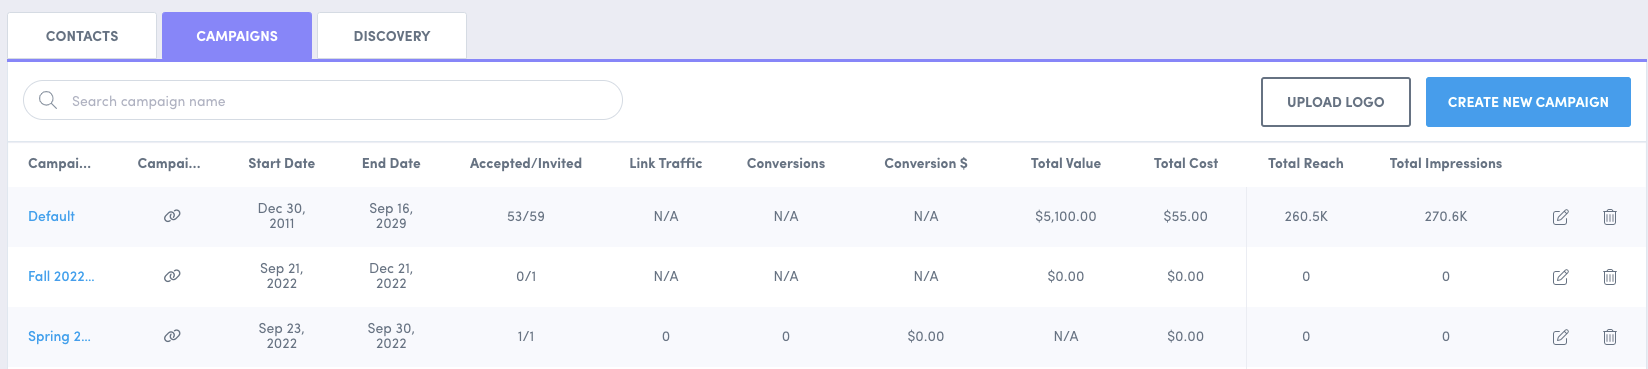
Campaign list view: Here you can see the overall performance for all of your campaigns so that you can sort and compare campaigns by key metrics, allowing you to quickly find your best and worst performing campaigns.
The information here is as follows:
-
Link Traffic: [only available with link tracking campaigns] Total number of times all links generated for this campaign have been clicked.
-
Conversions: [only available with link tracking campaigns] Total number of conversions for a link tracking campaign.
-
Conversion $: [only available with link tracking campaigns] Total conversion dollars for a link tracking campaign.
-
Total Value: Total value generated by all Creators in the campaign. Value added manually for each creator in the campaign view.
-
Total Cost: The total cost of the campaign: Cost is calculated based on the gifting activities added for each creator.
-
Total Reach: The total reach of all Instagram content collected into the campaign. Reach is defined as the total number of unique Instagram accounts that have seen a piece of content.
-
Total Impressions: The total impressions of all Instagram content collected onto the campaign. Impressions are defined as the total amount of times a piece of content has been seen.
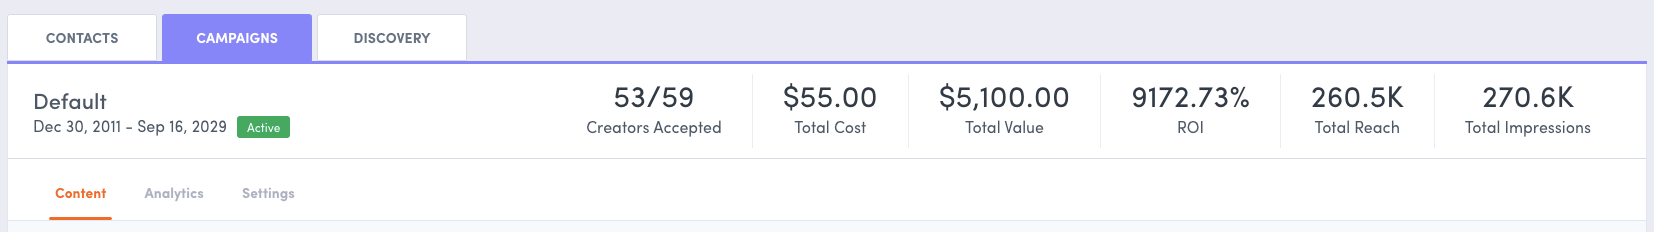
Campaign View Header: Clicking on a campaign from the list view will bring you to the “campaign view” for that campaign. The first thing displayed here is the campaign header which provides a summary of the campaign performance to date. These numbers are similar to the ones displayed in the campaign list view above with one exception:
-
ROI: Return on Investment, is calculated as a percentage using the following formula: (Total Value/Total Cost) * 100
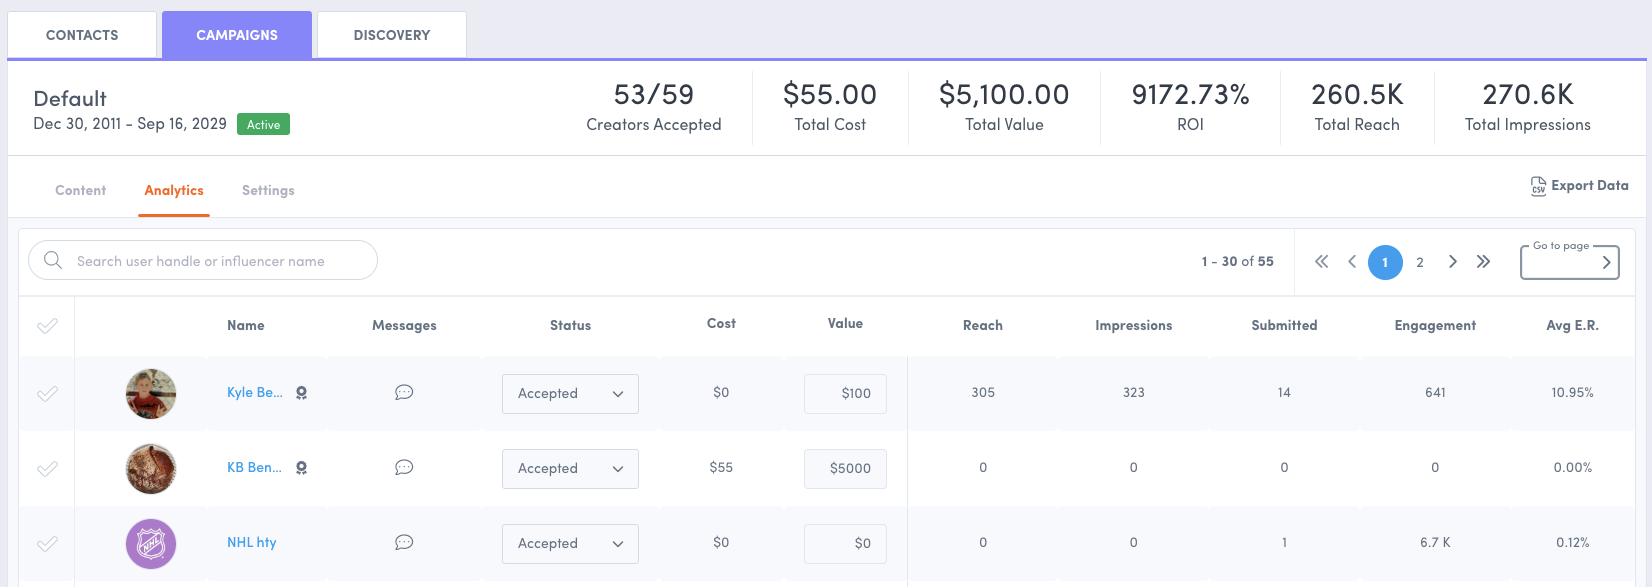
Campaign Analytics tab: Here you can see overall performance for all campaign participants listed out in a table so that you can sort and compare influencers by key metrics, allowing you to quickly find your best and worst performing influencers for the campaign. All numbers presented in this table are per individual Creator, two new numbers to note in this section are:
-
Engagement: The total number of likes, comments, saves & shares of all the content submitted by the creator for the camapign
-
Avg. E.R.: The average engagement rate of all the content submitted by the creator for the campaign. This is calculated with the following formula: (likes+comments+saves+shares) / # of followers / # of pieces of content
Creator Analytics Tab: Viewing a Creators profile analytics tab in a campaign will allow you to see detailed analytics and performance data about their account and social posts relevant to the campaign you are viewing.
To learn more about creator analytics, see Creator Analytics.
Do you have feedback or more questions? You can contact us through our Emplifi Customer Center.