Within Creators, there are two different levels of analytics available for you to view for your contacts:
-
Basic Analytics
-
Advanced Analytics
Basic Analytics
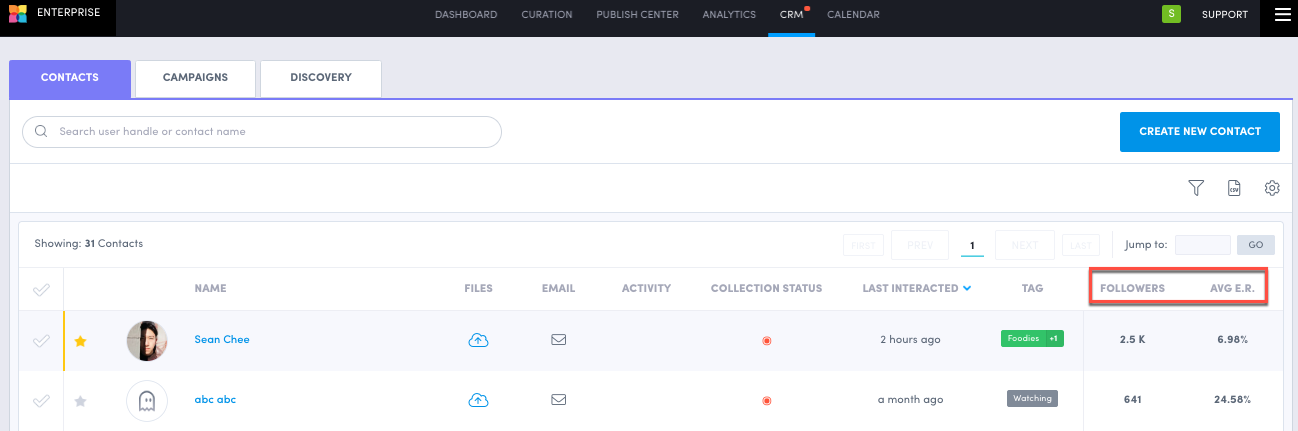
For any of your contacts that have a public Instagram Business/Creator, X (formerly Twitter) or Twitch account associated with them, we will be able to show:
User Level
-
Followers
-
Average Engagement Rate: the metric used to calculate the level of engagement a post receives from the user's followers - (# of total likes + comments) / followers / # of content
Content Level
-
Likes
-
Comments
-
Engagement - (likes + comments)
-
Engagement rate - (likes + comments) / followers
X (formerly Twitter)
-
Likes
-
Comments
-
Reposts
-
Engagement rate - (likes + comments + reposts) / followers
Twitch
-
Plays
-
Engagement rate - plays / followers
Advanced Analytics
For any of your contacts that have created a Creator Profile and have signed into your brand's Creator Portal Link & have connected a Public Instagram Business or Creator account, you will be able to view advanced Instagram analytics for the account they have attached.
User Level
-
Audience City - Cities of followers.
-
Audience Country - Countries of followers.
-
Audience Gender - The gender distribution of followers. Possible values:
M(male),F(female),U(unknown). -
Audience Age - The age distribution
-
Follower Count - plus followers gained & lost over time.
-
Total posts - plus posts over time
-
Total engagement - (total likes + total comments)
-
Average Post engagement - (total likes + total comments) / total posts
-
Average Engagement Rate - (# of total likes + comments) / followers / # of content
-
Reach
-
Profile Views - Total number of users who have viewed the user's profile within the specified period.
-
Reach - Total number of unique users who have viewed at least one of the user's media.
-
Impressions - Total number of times the user's media have been viewed.
Content Level
Instagram Photos, Videos & Carousels*
-
Engagement - (likes + comments + saves)
-
Impressions - Total number of times the content has been seen on Instagram.
-
Reach - Total number of unique Instagram accounts that have seen the content on Instagram.
-
Saved - Total number of unique Instagram accounts that have saved the content on Instagram.
-
Video Views - Total number of times the video content has been seen. For IG carousels, the number of times all videos within the album have been seen.
*in addition to everything in basic analytics
Instagram Reels
-
Comments
-
Likes
-
Plays - Number of times the reels starts to play after an impression is already counted. This is defined as video sessions with 1 ms or more of playback and excludes replays.
-
Reach - Number of unique accounts that have seen the reel at least once. Reach is different from impressions, which can include multiple views of a reel by the same account.
-
Saved
-
Shares
-
Total Engagement - (likes + saves + comments + shares)
Instagram Stories
-
Exits - total number of times someone exited the story.
-
Impressions - total number of times the story has been seen on Instagram.
-
Reach - total number of unique Instagram accounts that have seen the story.
-
Replies - Total number of replies on the story. Value does not include replies made by users in some regions. These regions include: Europe starting December 1, 2020 and Japan starting April 14, 2021. If the Story was created by a user in one of these regions, returns a value of 0.
-
Forward Taps - Total number of taps to see this story's next photo or video.
-
Backward Taps - Total number of taps to see this story's previous photo or video.
-
Completion rate - the percentage of users that watched the story fully without exiting, calculated as: % 100 - (Exits / Impressions) * 100
Exporting Data
You can also export a CSV file of your contacts' general analytics, profile card information, and tags by clicking the CSV file icon and then clicking "Export Contacts."
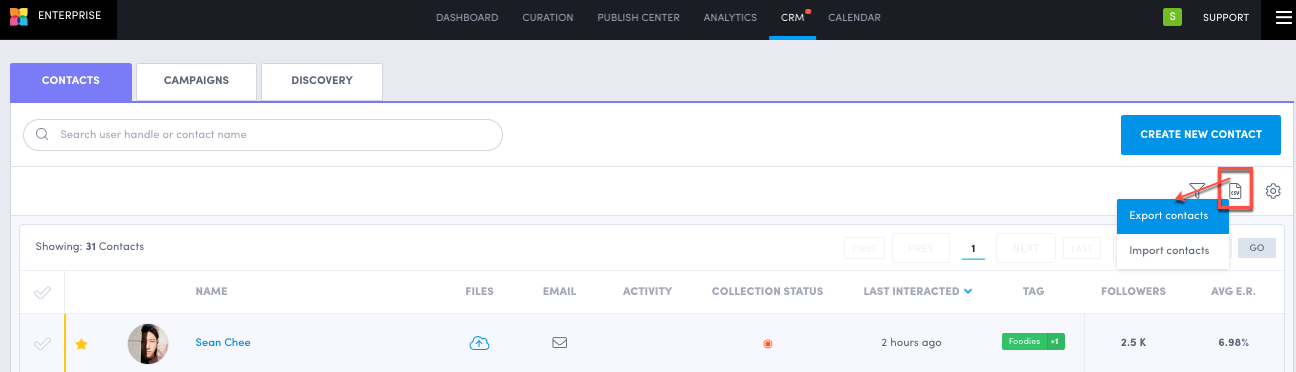
You can also export a CSV of a creator's Content and Overview analytics by clicking the CSV file icon and then clicking "Export Contacts."