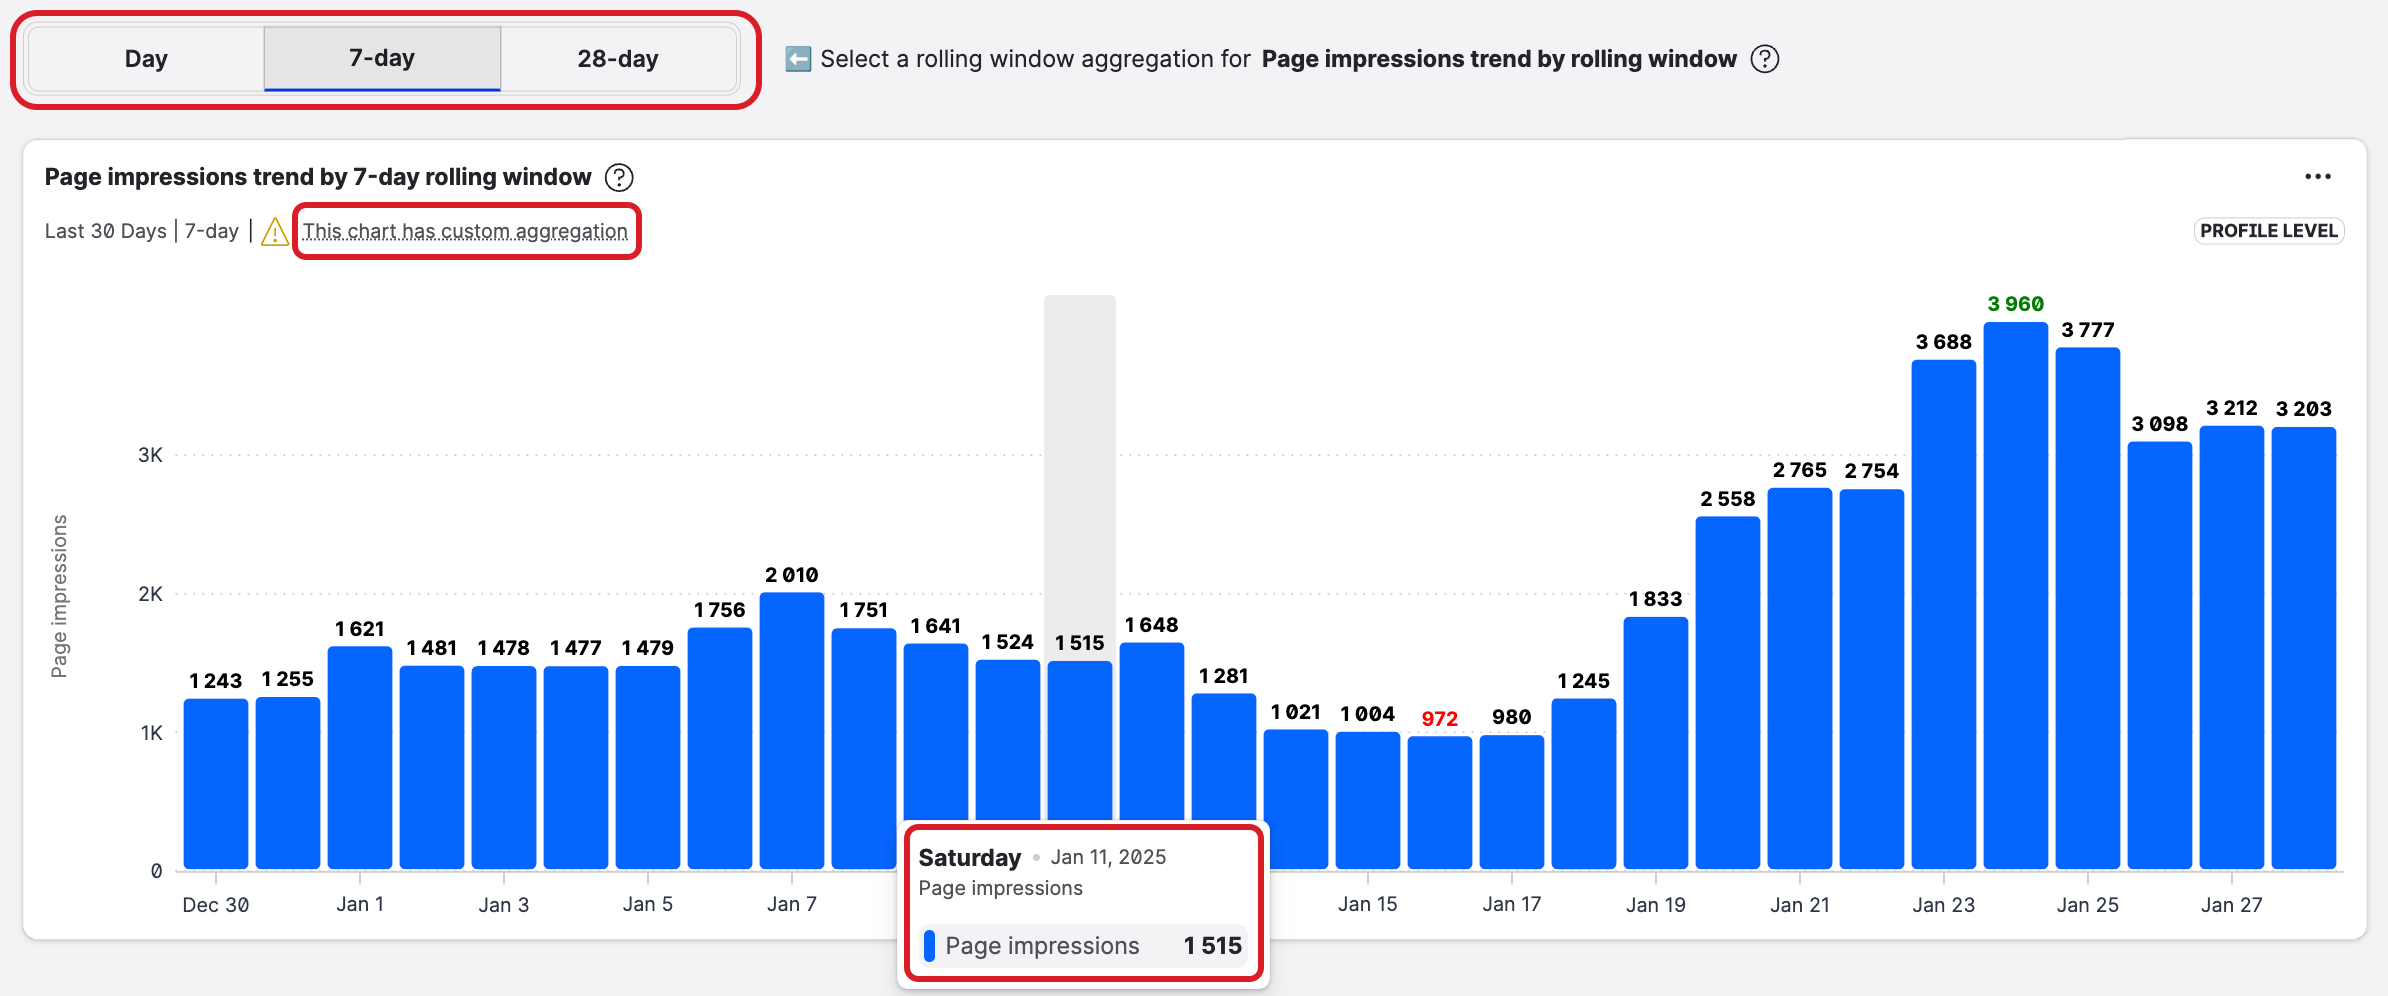
Some boards support widgets that display a distinct rolling aggregation data.
In such cases, the data in the widget is aggregated by the last 1, 7, or 28 days on a daily basis.
Any widget supporting rolling aggregation will feature a set of dedicated aggregation controls and the following warning: This chart has custom aggregation.
Rolling aggregation settings for a specific widget overrides the the board-level aggregation setting but only for this specific widget.
This includes time comparison where the widget setting overrides the board settings.
Where to find rolling aggregation widgets
Rolling aggregation widgets are currently available on the following boards:
The following rolling aggregation widgets…
-
Total Page Impressions
-
Total Page reach
-
Insights reach 7 days
-
Insights reach 28 days
-
Total Page Post Impressions
-
Total Page Post Reach
Updated June 2026
On Facebook Profile insights boards, Insights reach 7 days and Insights reach 28 days now count unique media viewers (was unique impressions). Values may read higher than before. Historical data is backfilled from May 1, 2025. This is expected and reflects Meta's change in how viewers are counted, not a calculation change in Emplifi.
For full context, see Facebook Metric Deprecation (June 2026).
…are available on these boards
-
Social profiles > Facebook > Owned profiles > Profile insights:
-
Overview board
-
Profile vs. Profile
-
Time comparison
-
-
Social profiles > Facebook > Owned profiles > Global insights overview:
-
Overview
-
The following rolling aggregation widgets…
-
Total Profile Reach
-
Total Profile Impressions
…are available on these boards
-
Social profiles > Instagram > Overview
-
Overview board
-
Profile vs. Profile
-
Time comparison
-
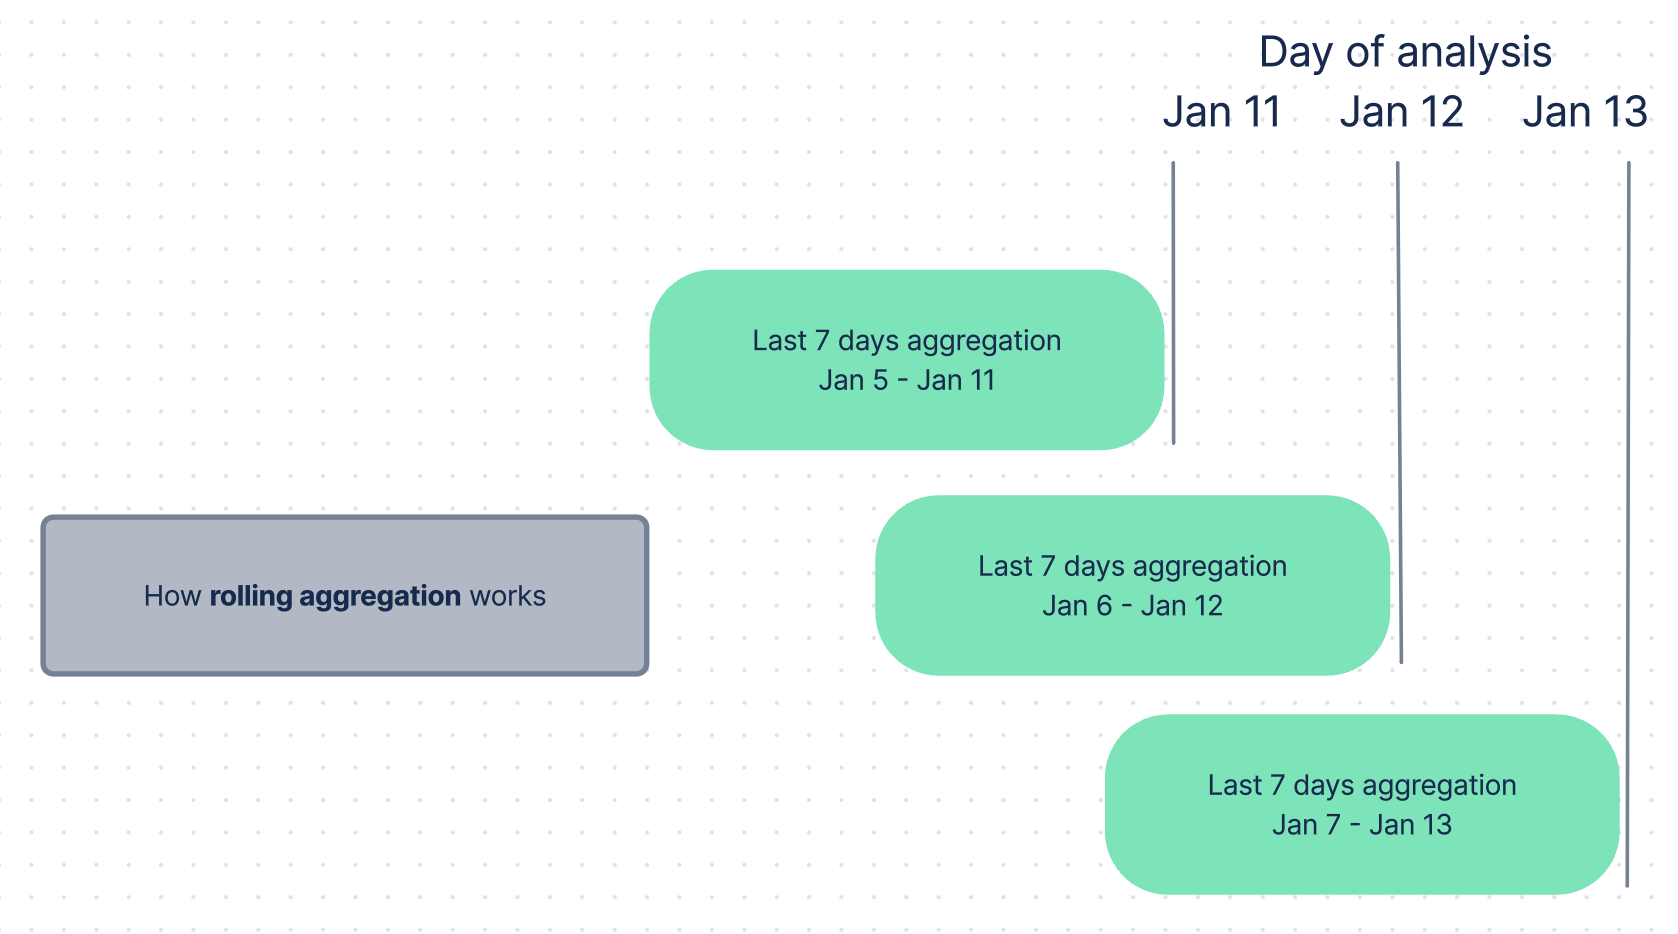
What is rolling aggregation
Rolling aggregates is an advanced statistical tool that shows the trend in the observable data in a way that reduces influence of seasonal spikes/drops and extraordinary events.
This is how it works.
The following example is for education purposes only.
-
the column on January 11
-
displays aggregated data over a defined time period… (7 days)
-
that immediately precedes the day of analysis… (January 11 - January 5)
-
the column on January 12
-
displays aggregated data over a defined time period… (7 days)
-
that immediately precedes the day of analysis… (January 12 - January 6)
-
and so on
In other words, two consecutive analysis will both include data from the same 6 days. You can say that those 6 days roll from one day’s aggregation to another.e
This might sound confusing so let’s visualize it 🙂
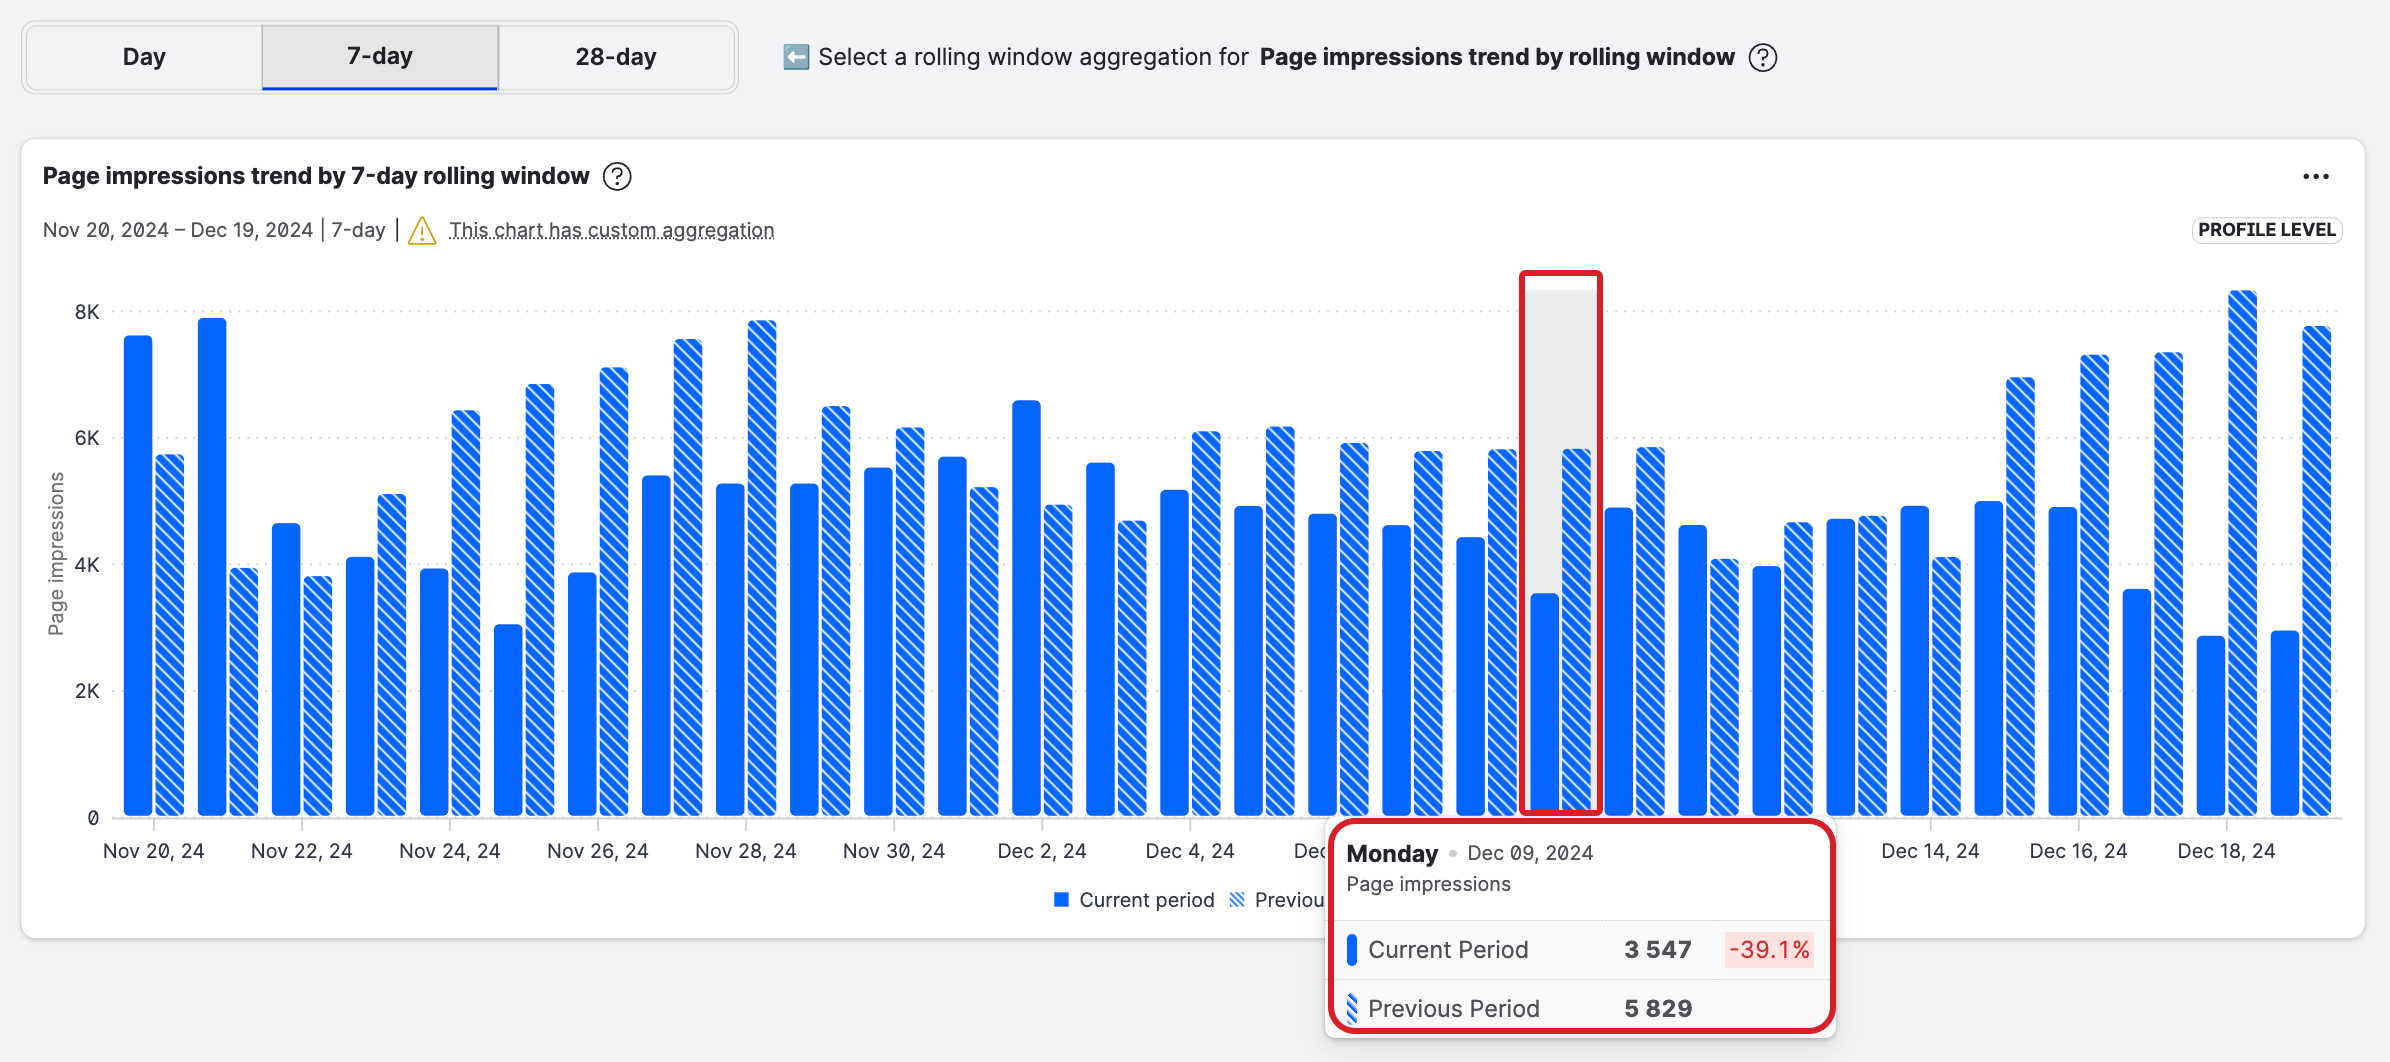
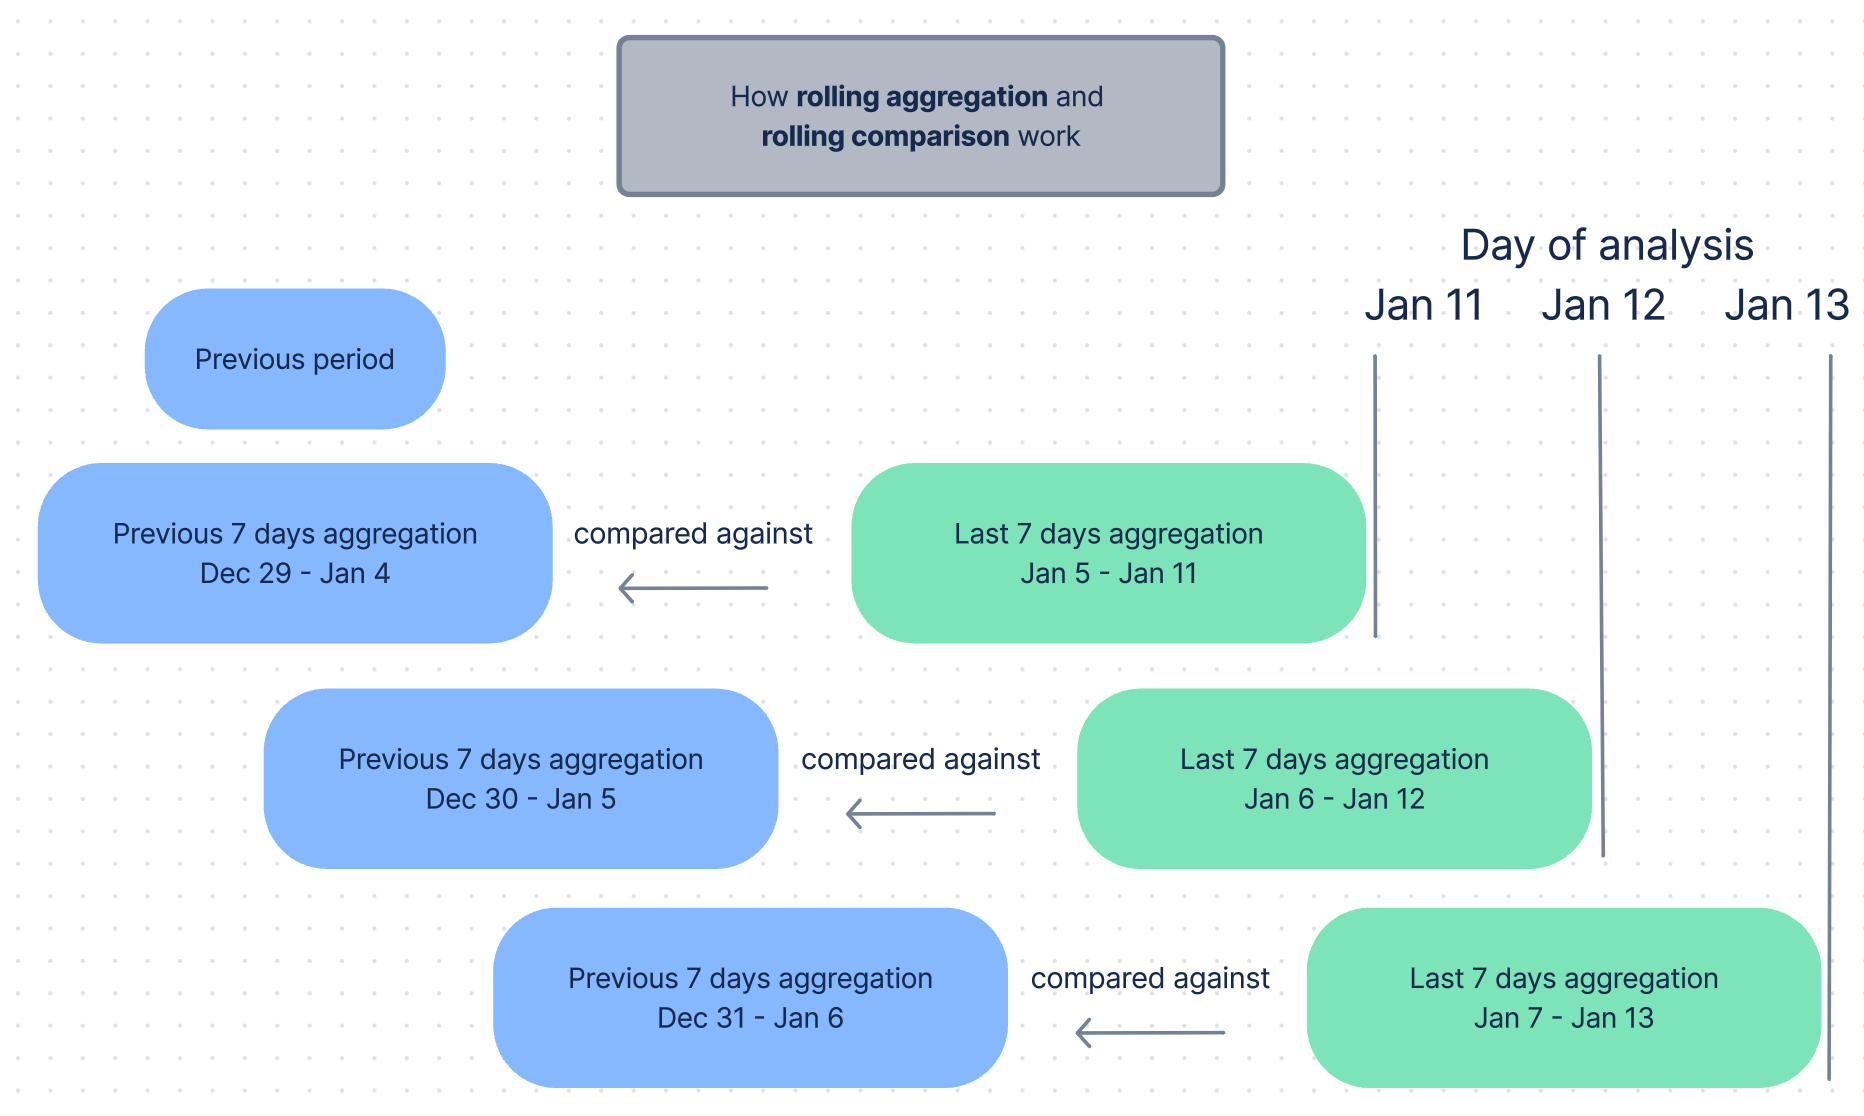
Comparing rolling aggregations
Now that you understand rolling aggregations, let’s look at how you can compare them.
Comparing rolling aggregations introduces two new terms.
-
Current period = Januart 5 - January 11
-
Previous period = December 29 - January 4
What you see in the following chart is two bars on each day
-
one presenting data aggregated over the current period
-
the other representing data aggregated over the previous period
Now, let’s see what the analyses conduced on January 11, January 12, and January 13 would cover.
As you can see, there are overlaps in the aggregations that we are comparing.
In macroeconomics, rolling aggregations and comparisons are used to iron out expected seasonal fluctuations in, for example, GDP (gross domestic product) and retail sales.
For example, a typical month-over-month comparison between December and November retail sales would show a massive increase in December driven by the usual Holiday retail fever and subsequent sales.
A chart of rolling aggregates (and comparisons) will still reflect holiday sales’s surge, but the curve will be smoother providing a balanced overview of the sales development by introducing time-based aggregation.