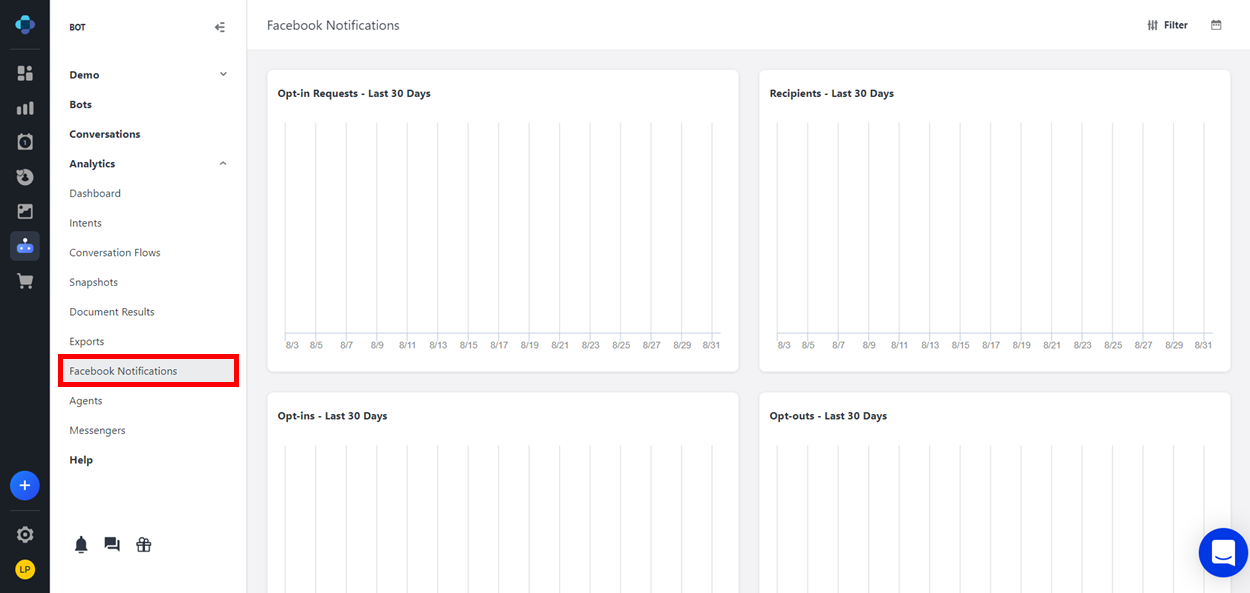
The Facebook Notifications Analytics page provides data about the recurring notifications sent to users from your company's Facebook page via Facebook Messenger. This information allows you to gauge the effectiveness of your notifications by showing how users interact with them. For more information, see the "Facebook Notifications Settings Window Layout" section of the Distribution page.
Accessing the Facebook Notifications analytics page
-
From the Application Bar, click Analytics.
-
Click Facebook Notifications.
Selecting a Facebook notification
-
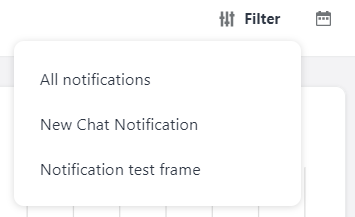
In the top right corner of the Facebook Notifications Analytics page, click button.
A drop-down menu appears. -
Select the Facebook notification that you would like to view the analytics of, or click All notifications to view the combined analytics for all the notifications that you've set up. The reports on the screen adjust to display the analytics of the selected notification.

Use the Date Range button to adjust the time period of all the reports on the Facebook Notifications Analytics page.
Reports
Types of reports
The Facebook Notifications Analytics page contains four reports, each detailing a specific metric of the selected recurring notification.
Opt-In requests
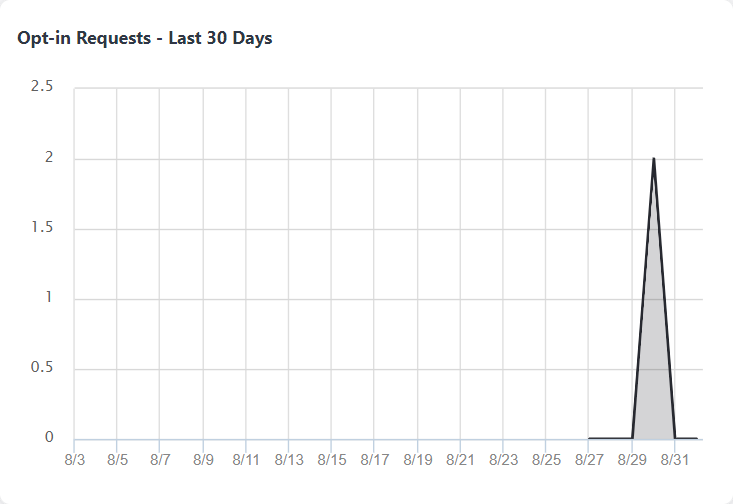
This report shows the number of users have requested to opt-in to the selected recurring notification in the specified time period.
Recipients
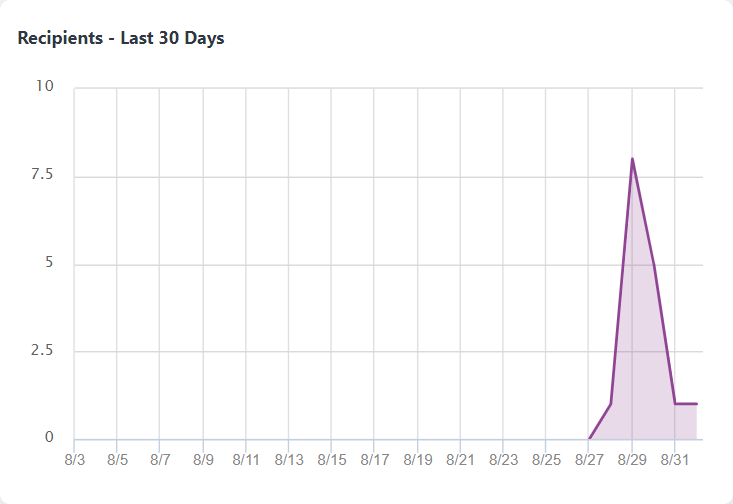
This report shows the number of users that have received one of the selected recurring notifications in the specified time period.
Opt-ins
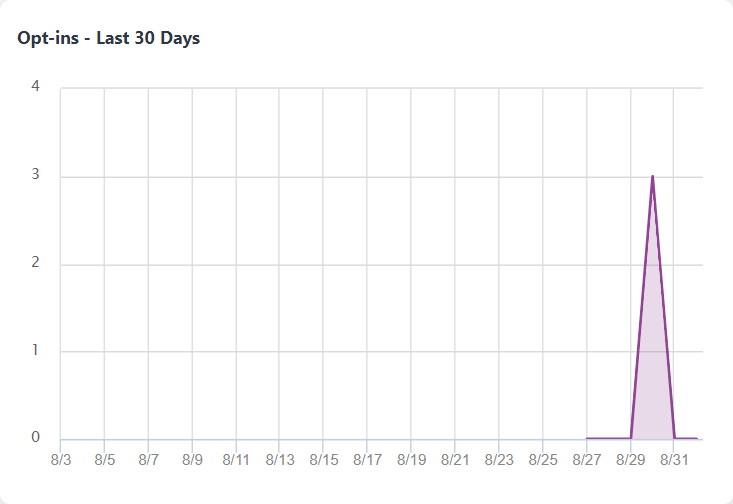
This report shows the total number of users who are currently opted-in to received the selected recurring notifications in the specified time period.
Opt-outs
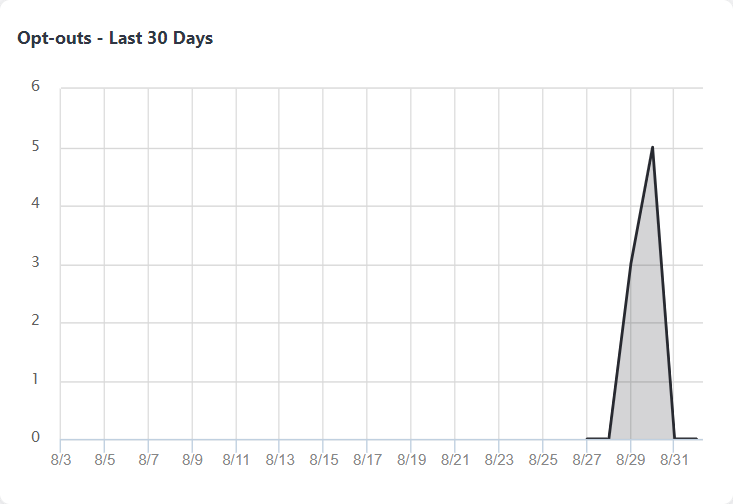
This report shows the number of users who have opted-out from receiving the selected recurring notification in the specified time period.
Report buttons
Hover over a report to display a row of buttons in its top right corner.
|
Button |
Description |
|---|---|
|
|
Click here to choose the date range of the selected report. If you select Custom from the drop-down menu, a calendar will appear for you to select a start date and an end date.
|
|
|
Click here to adjust the report's formatting options. The drop-down includes the following sections:
This section also contains the option to remove the report. To do so, click the Remove button. In the resulting empty column, click the Add button to re-add the report to the page. |