The Conversation Flow Analytics pages provides information about user interactions within specific conversation flows. This information allows you to see where users are spending the most time within your bots' conversation flows, and how they are moving through those conversation flows. For more information, see Conversation Flows.
Accessing the Conversation Flow analytics page
-
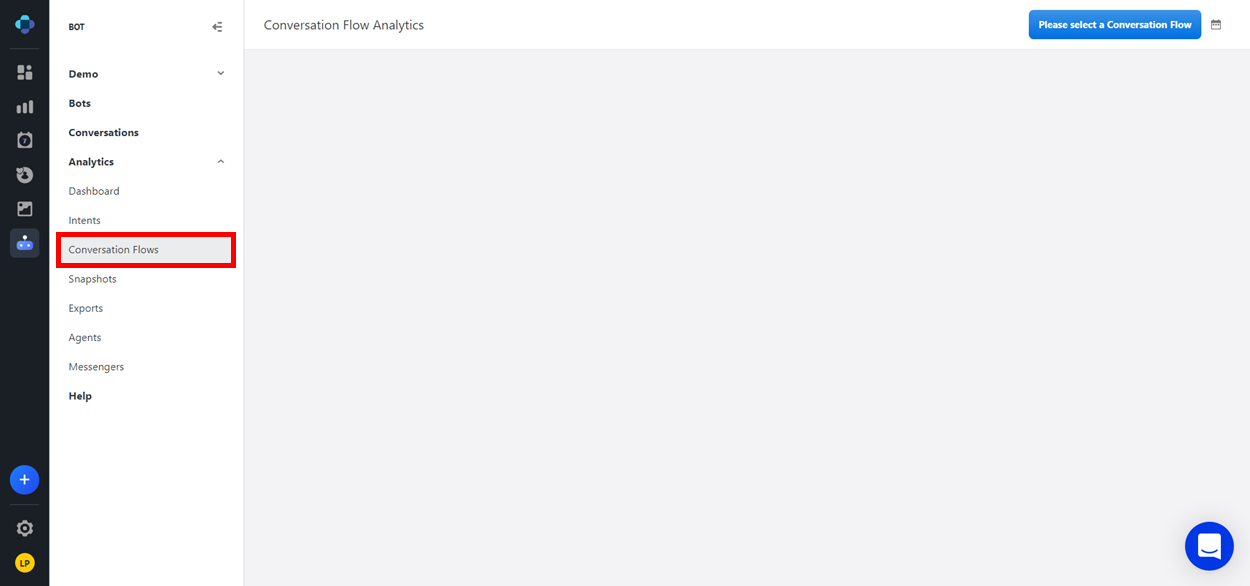
From the Application Bar, click Analytics.
-
Click Conversation Flows.
Selecting a Conversation Flow
-
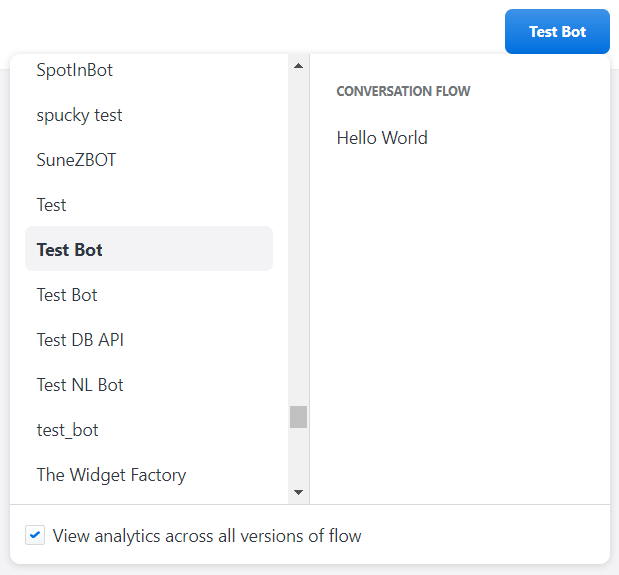
In the top right corner of the Conversation Flow Analytics page, click Please select a Conversation Flow. A drop-down menu appears.
-
The drop-down menu contains two columns. The column on the left contains a list of your company's bots; the column on the right contains a list of the conversation flows belonging to the selected bot (this column is empty until a bot is selected).
When you uncheck the box next to "View analytics across all versions of flow", a third column titled "Versions" appears in between the original two columns. This new column contains a list of every published version of the chosen flow. Select one to view the analytics specific to that version.
-
-
Select the Bot, and then the Conversation Flow (and, optionally, the Version) that you would like to view the analytics of. An array of reports appear on the screen.
Conversation Flow analytics page layout
Buttons
|
Number |
Name |
Description |
|---|---|---|
|
1 |
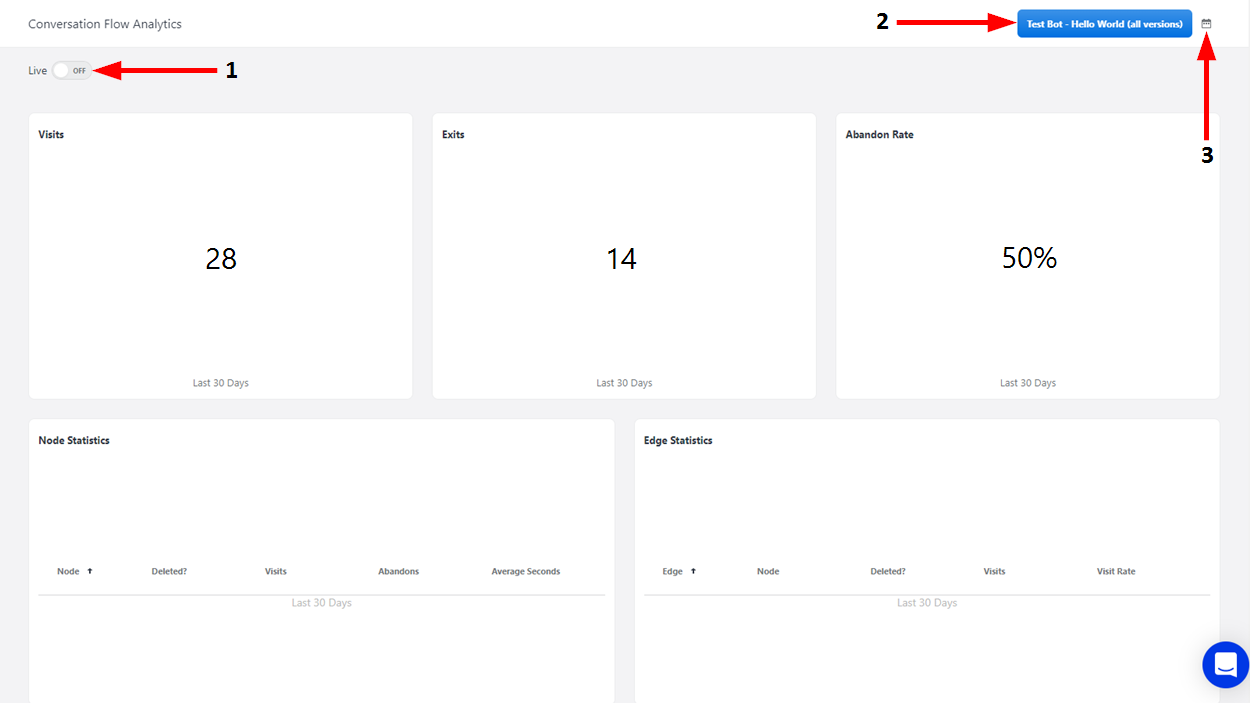
Live ON/OFF Toggle |
Click here to choose whether or not live conversation flow analytics appear in the reports. |
|
2 |
Date Range |
Click here to set the date range for all reports on the conversation flow analytics page. If you select Custom from the drop-down menu, a calendar will appear for you to select a start date and an end date.
|
|
3 |
Select Conversation Flow |
Click here to select a conversation flow that you would like to view the analytics of. By default, this button reads, "Please select a Conversation Flow". When you have selected a flow, the button's default text is replaced with text that follows this format: "Bot Name - Conversation Flow (Version)". |
Reports
Types of reports
Once you have selected a conversation flow, three reports appear on the top row of the screen, and two larger reports appear on the bottom row.
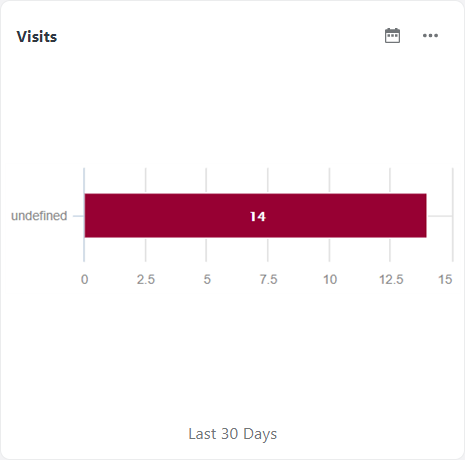
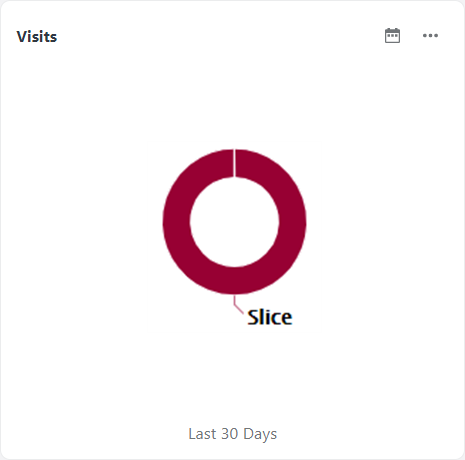
Visits
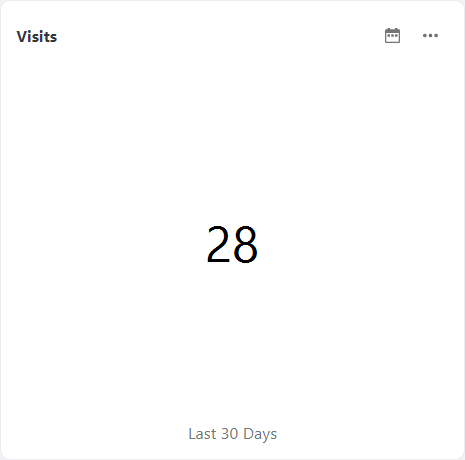
This report shows the number of times that users have entered this conversation flow in the specified time period.
Exits
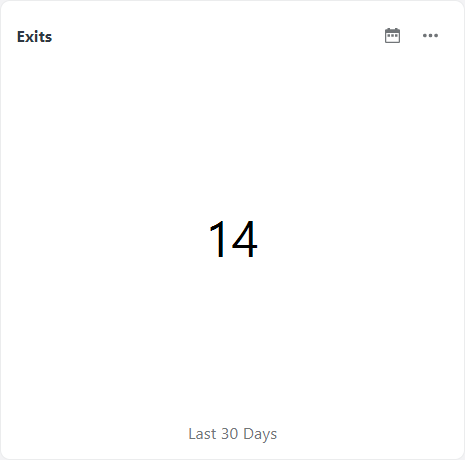
This report shows the number of times that users have exited this conversation flow through a defined exit flow (i.e. via an exit edge, path to a child flow, or intent-based shortcut to a different flow) in the specified time period.
Abandon rate
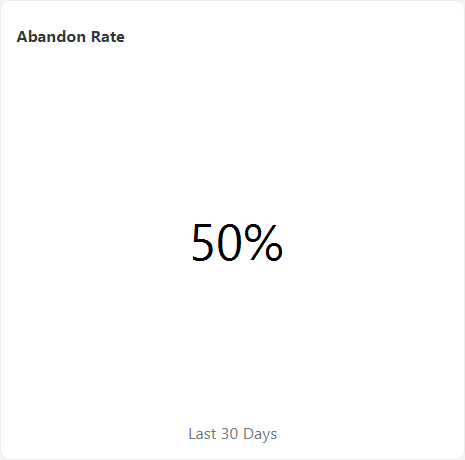
This report shows the percentage of users who have left this flow before the conversation ended, or who became inactive in this flow for more than fifteen minutes in the specified time period.
Node statistics
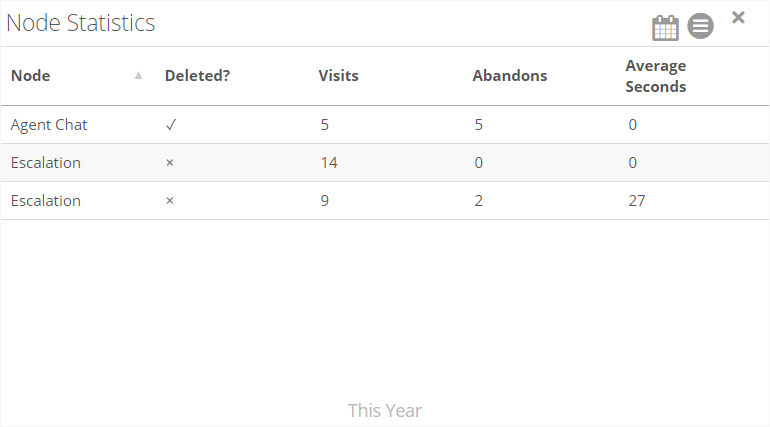
This report shows the number of times a user reached a specific node in this flow, the number of times a user left the bot from that node, and the average number of seconds a user spent in that node in the specified time period.
Edge statistics
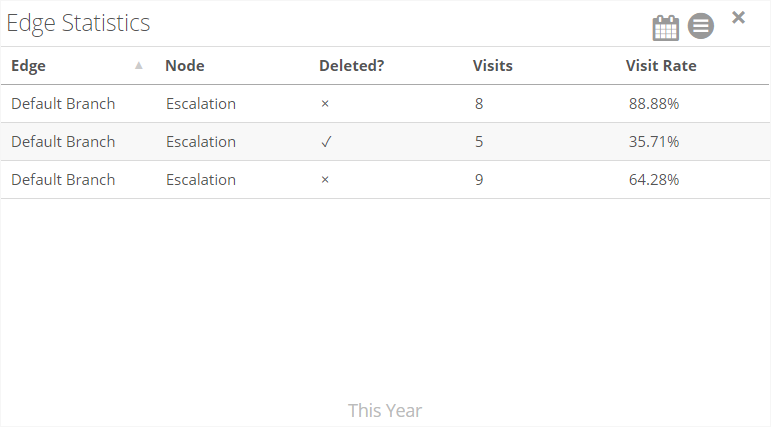
This report shows the paths that users took, the node they came from when taking each path, the number of times they took the path, and the percentage of users who took the path.
These metrics should be reviewed often to ensure that abandons or time spent is not too high - which could signal that the node is either too complicated, has too many options, or is unclear to users.
Report buttons
Hover over a report to display a row of buttons in its top right corner.
|
Button |
Description |
|---|---|
|
|
Click here to choose the date range of the report. If you select Custom from the drop-down menu, a calendar will appear for you to select a start date and an end date.
|
|
|
Click here to adjust the report's formatting options. The drop-down menu varies by report, and can include the following sections:
This section also contains the option to remove the report. To do so, click the Remove button. In the resulting empty column, click the Add button to display either the Intent Matches report or the Matched Intent Utterances report. |
|
|
Click here to delete the report. The widget will become empty, allowing you to add a different report to it. |
Report chart types
For the Visits, Exits, and Abandon Rate reports, the following chart options are available.
List
Pie Chart
Bar Chart