Unified Analytics provides two approaches for analyzing Care performance, giving you the flexibility to choose the reporting method that best suits your needs.
You can use preset boards — ready-to-use boards pre-loaded with a curated set of data visualizations covering the most important aspects of Care performance. Preset boards require no configuration and are available immediately.
Alternatively, you can use Dynamic Boards in Unified Analytics to build fully customized reporting views. Dynamic boards allow you to define your own widgets, apply custom breakdowns, and configure filters to focus on the metrics most relevant to your operations.
Access Care boards in Unified Analytics
To access Care preset boards, go to Unified Analytics → Care. For general information about Unified Analytics and how to work with boards, see Using Unified Analytics .
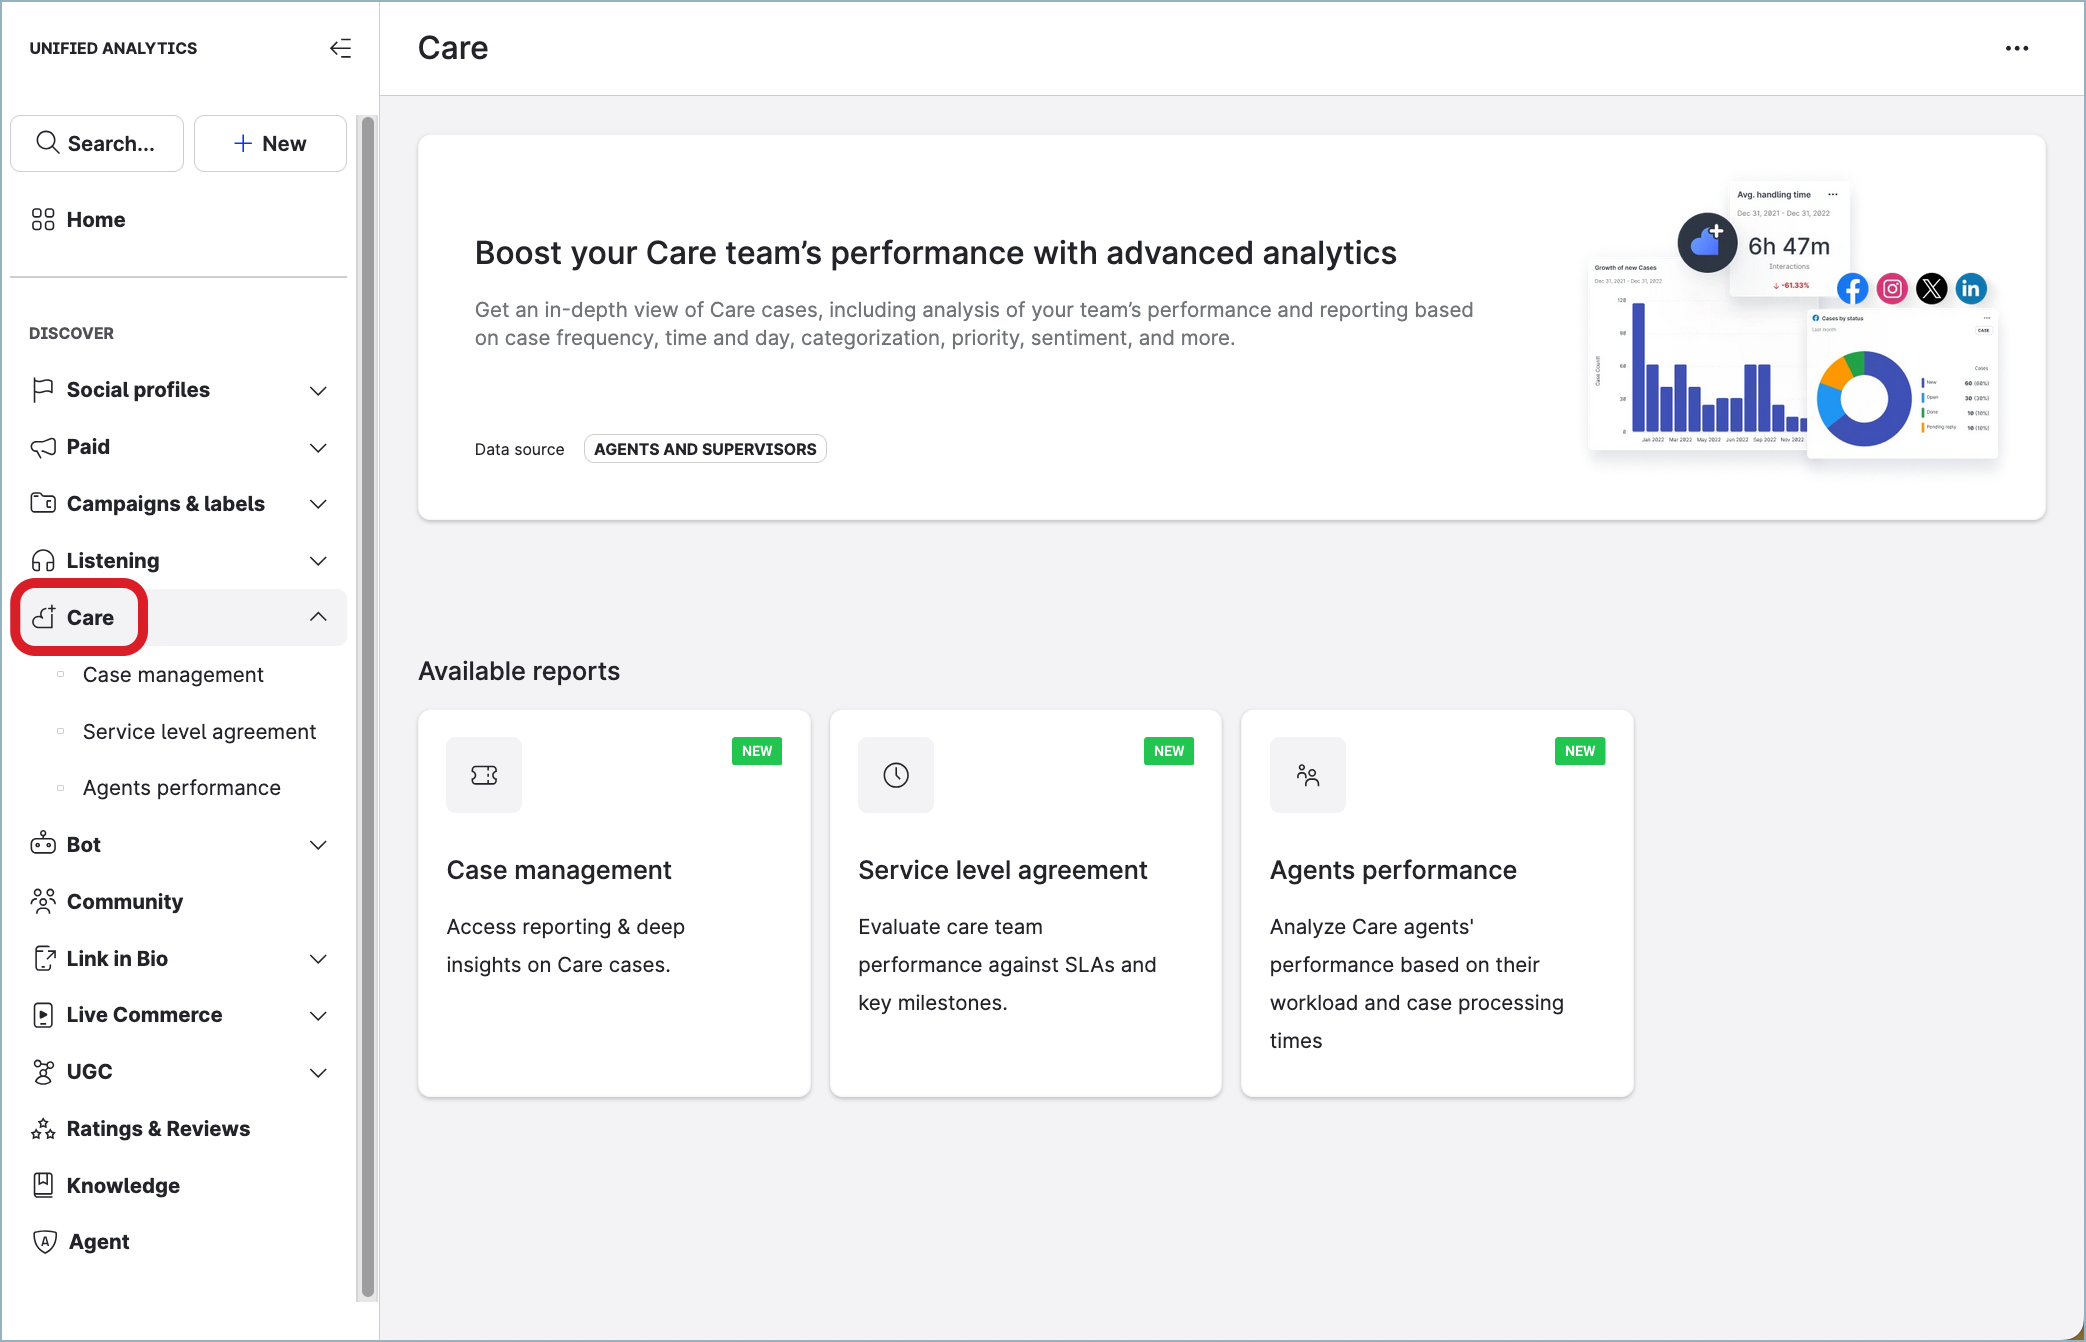
Unified Analytics includes three preset boards for Care performance. Each board is pre-loaded with a set of widgets and requires no configuration to use.
Care preset boards are in early access. Data consistency cannot be guaranteed during this period, and some features may change before the full release. Report any bugs you encounter. If you have questions, contact your Customer Success Manager.
Case management board
The Case management board allows you to analyze various aspects related to Care cases: created/resolved/reopened/unresolved cases, case distribution by platform, priority, first response/resolution time, the number of one-touch cases, and many more. The board provides insights into overall workload and responsiveness as well as types of issues reported by customers, trends, and root causes of problems.
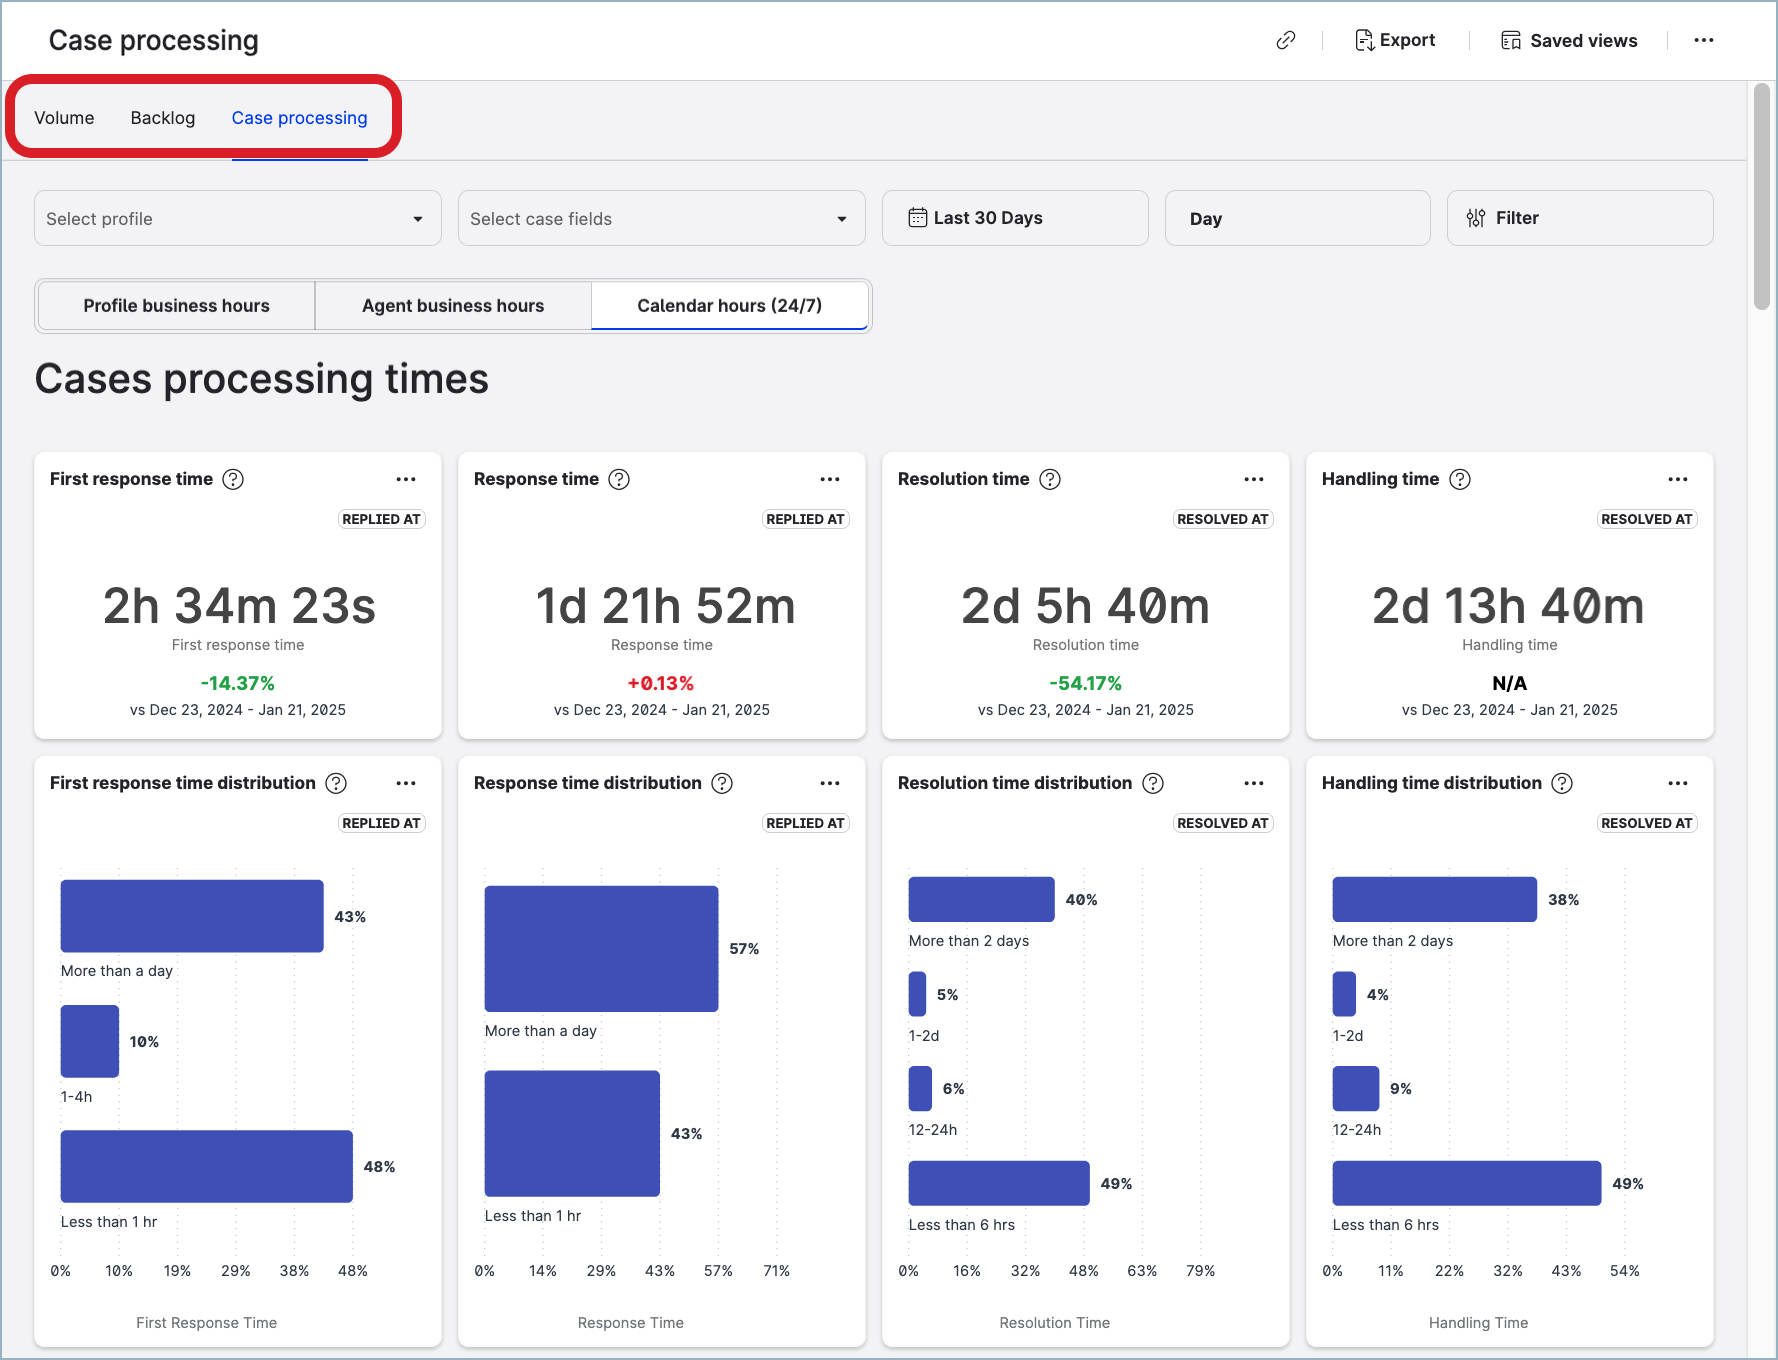
The board has the following tabs:
-
Volume allows you to get an overall view of your Care performance.
-
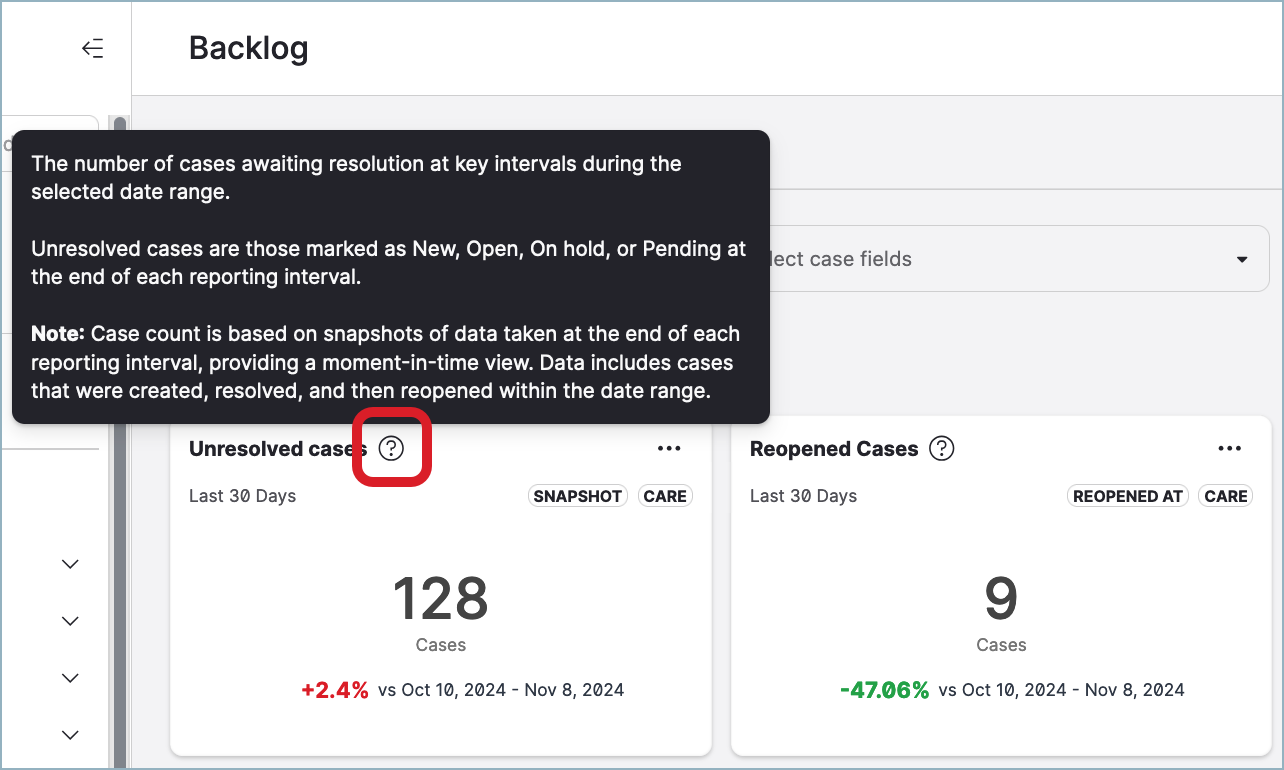
Backlog focuses on unresolved cases specifically.
-
Case processing allows you to get insights into how fast cases are being processed by agents.
Data availability
Be aware of the following:
-
The data available on the Volume and Backlog tabs is based on the Care cases created on November 1, 2024, the earliest. Data about the cases created before November 1, 2024, is not available on these tabs.
-
The data available on the Case processing tab is based on the Care cases created on March 1, 2025, the earliest. Data about the cases created before March 1, 2025, is not available on these tabs.
-
Deleted Care cases are not shown and not used in calculations.
The underlying data may be subject to changes during the early access period.
Understand the board data
Metrics
The source of data for the Volume and Backlog tabs of the board are the following metrics:
-
Created cases
-
Reopened cases
-
Resolved cases
-
Unresolved cases
The source of data for the Case processing tab of the board are the following metrics:
-
First response time
-
Response time
-
Handling time
-
Resolution time
Widgets
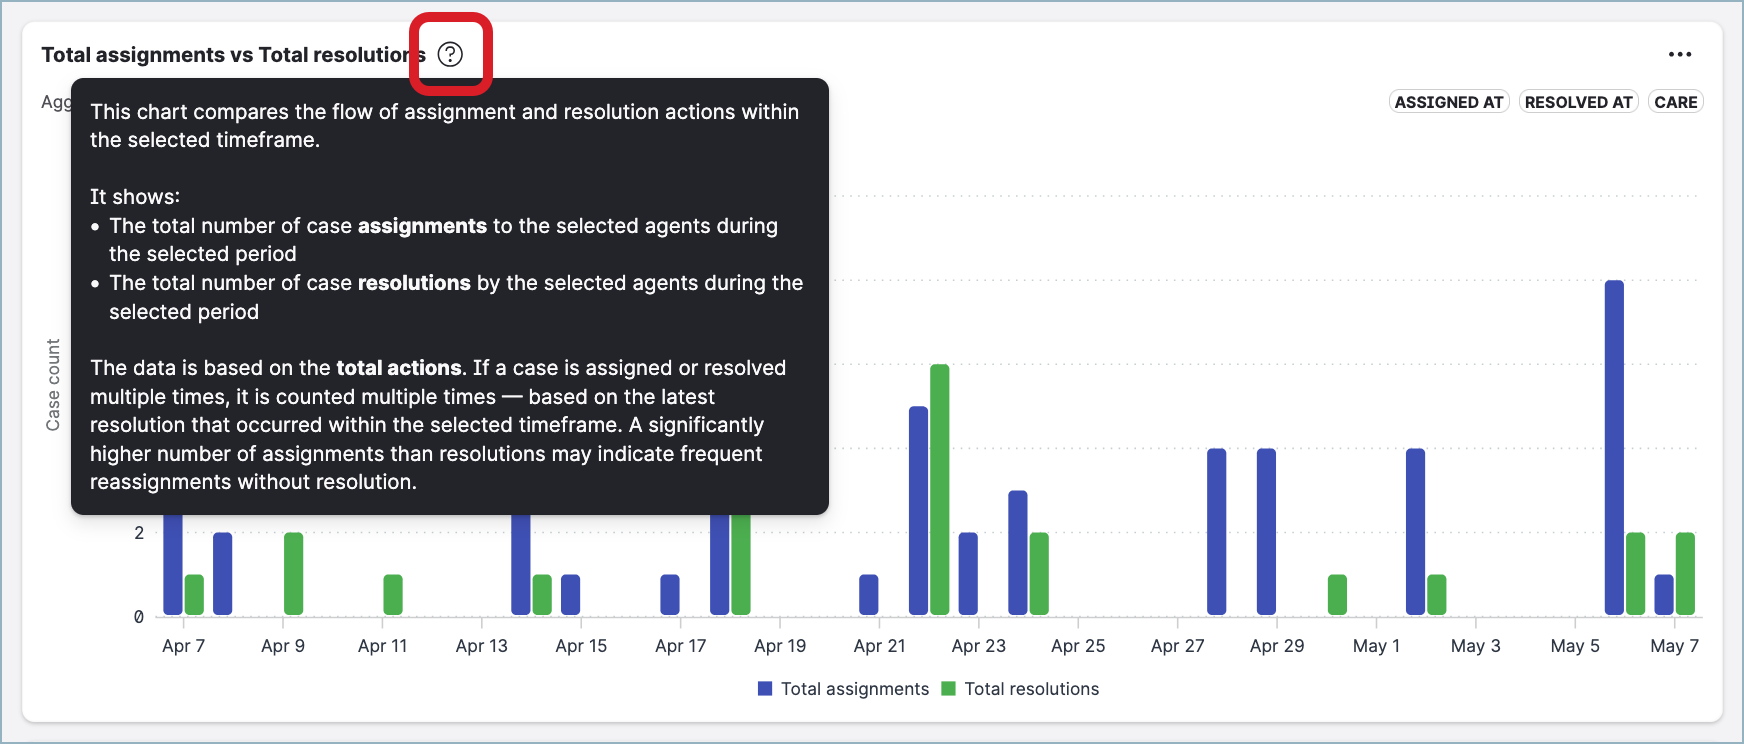
The board comes with a set of pre-defined widgets based on the metrics, such as created/unresolved cases sliced by various attributes (case status, platform, profile, sentiment, case attribute, and so on), created cases broken down by hour of the day, created cases vs. resolved cases, first response/resolution time, the number of one-touch cases, and many more.
Each widget has a tooltip with a comprehensive explanation of what data it shows and any additional details that you may need to interpret the data correctly.
Filters
To get more specific results, you can apply additional filters to the board:
-
Platform
-
Language
-
Sentiment
-
Priority
-
Care agent[1]
-
User group
-
(For some widgets only) Custom case field
[1] Filtering by Care agent reflects the contribution of each agent involved in resolving the cases. Case attribution to agents depends on the data attribution type of an individual widget (for more information about the data attribution, see further in this article):
-
Created time: The agent currently assigned to the case
-
Replied at: The agent who sent the reply
-
Resolved at: The agent who was assigned to the case when the case was resolved
-
Reopened at: The agent who was assigned to the case when the case was reopened
-
Snapshot: The agent who was assigned to the case at end of the selected time range
Data attribution
Data attribution helps you understand how specific data points are categorized and visualized based on their relevance to different timeframes. By assigning data to specific timestamps or events, data attribution provides clarity and consistency of the metrics.
Data attribution can correspond to a specific event in the lifecycle of a Care case (when it was created/reopened/resolved) or what the state of a Care case was at a given point in time (snapshot). The widgets of the Case management board use the following types of data attribution:
-
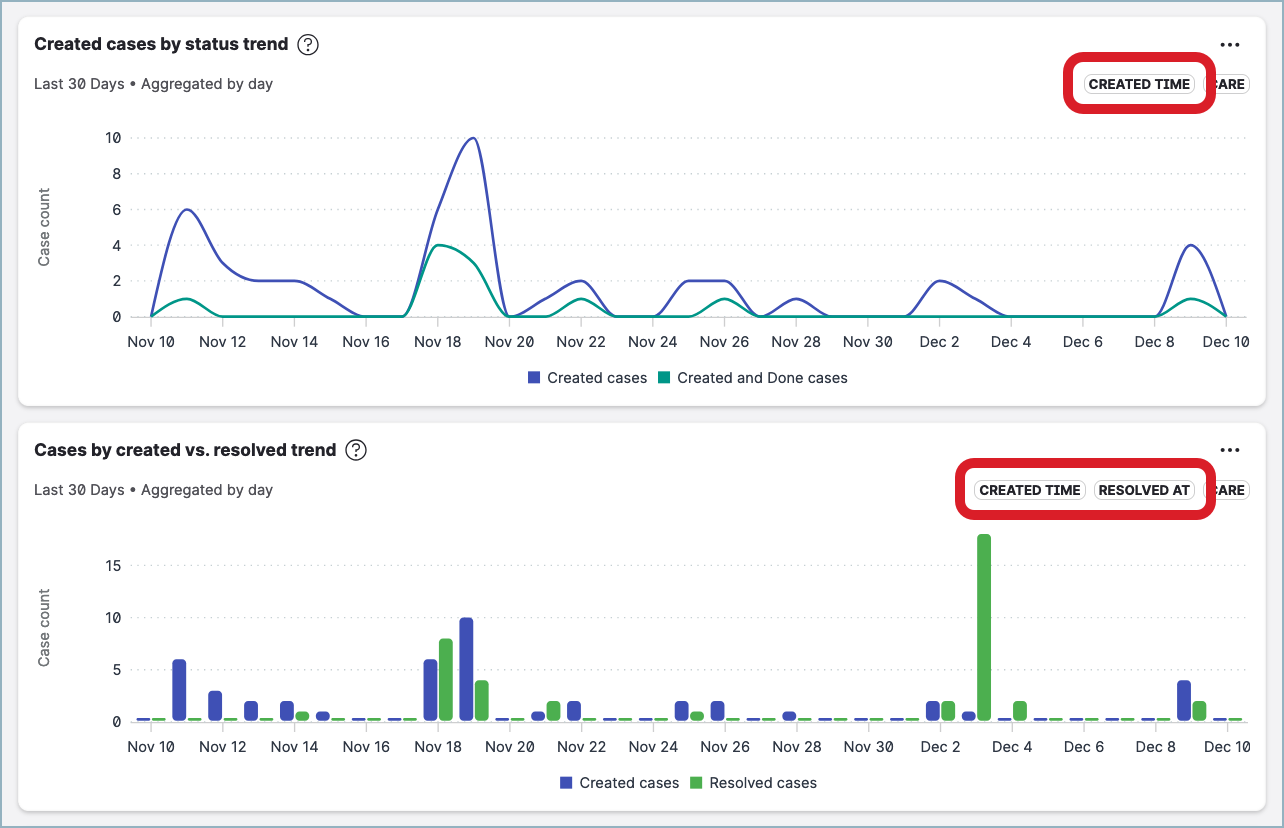
Created time
Care cases are attributed to the date/time when they were created (regardless of subsequent actions), within a specific time range. For example, all replies linked to a case are aggregated and attributed to the case’s creation time; this includes replies that occurred both during the time range and after the time range, consolidating them under the original creation timestamp. -
Replied at
Care cases are attributed to the date/time when replies were sent to customers, within a specific time range. This attribution type tracks agent or system responses regardless of when the case was created or resolved, showing communication activity tied to the response timestamps. -
Resolved at
Care cases are attributed to the date/time when they were resolved (transitioned to the status ofDoneorSpam), within a specific time range. This attribution type reflects data only for the cases that were resolved during the specified time range and remained resolved till the end of it. It captures the last time a case was resolved within the time range and includes cases created before the time range, making it ideal for assessing resolution trends and efficiency. -
Reopened at
Care cases are attributed to the date/time when they were reopened (transitioned from the status ofDoneorSpamtoNew,Open,Pending, orOn hold), within a specific time range. This attribution type highlights situations where cases require additional attention after they have been resolved and provides visibility into recurring issues or rework demands. -
Snapshot
This attribution type provides a static view of data at the end of a specific time range or time intervals (hour, day, week, month) for widgets displaying trends in time. It disregards when Care cases were created, reopened, or resolved, offering a "moment-in-time" perspective, which is particularly valuable for identifying trends, auditing, and maintaining a consistent historical record.
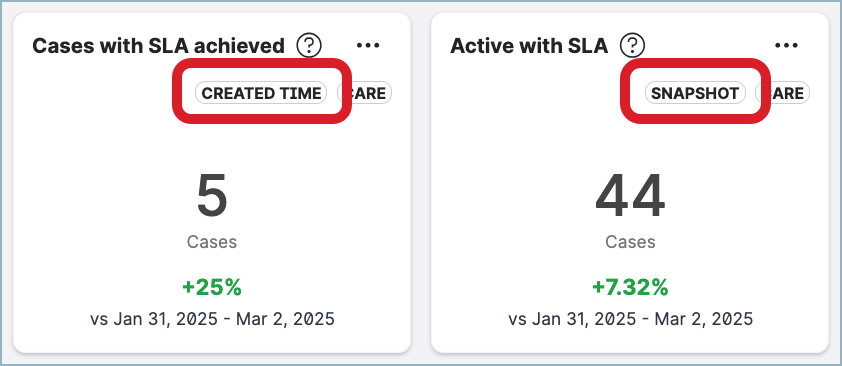
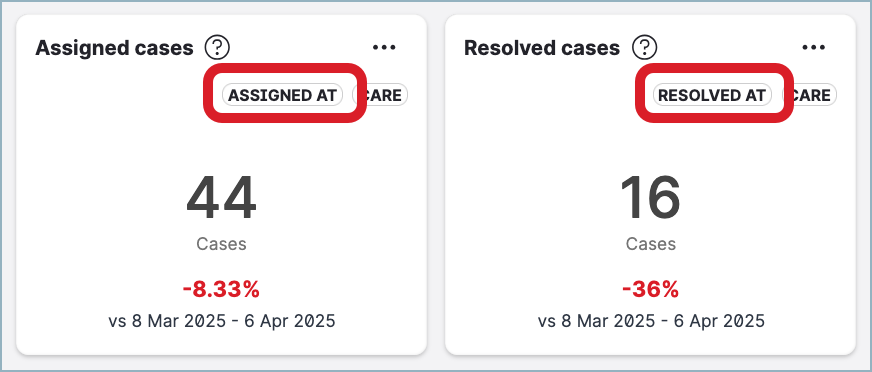
The widgets use badges to indicate the attribution type they employ to simplify data interpretation:
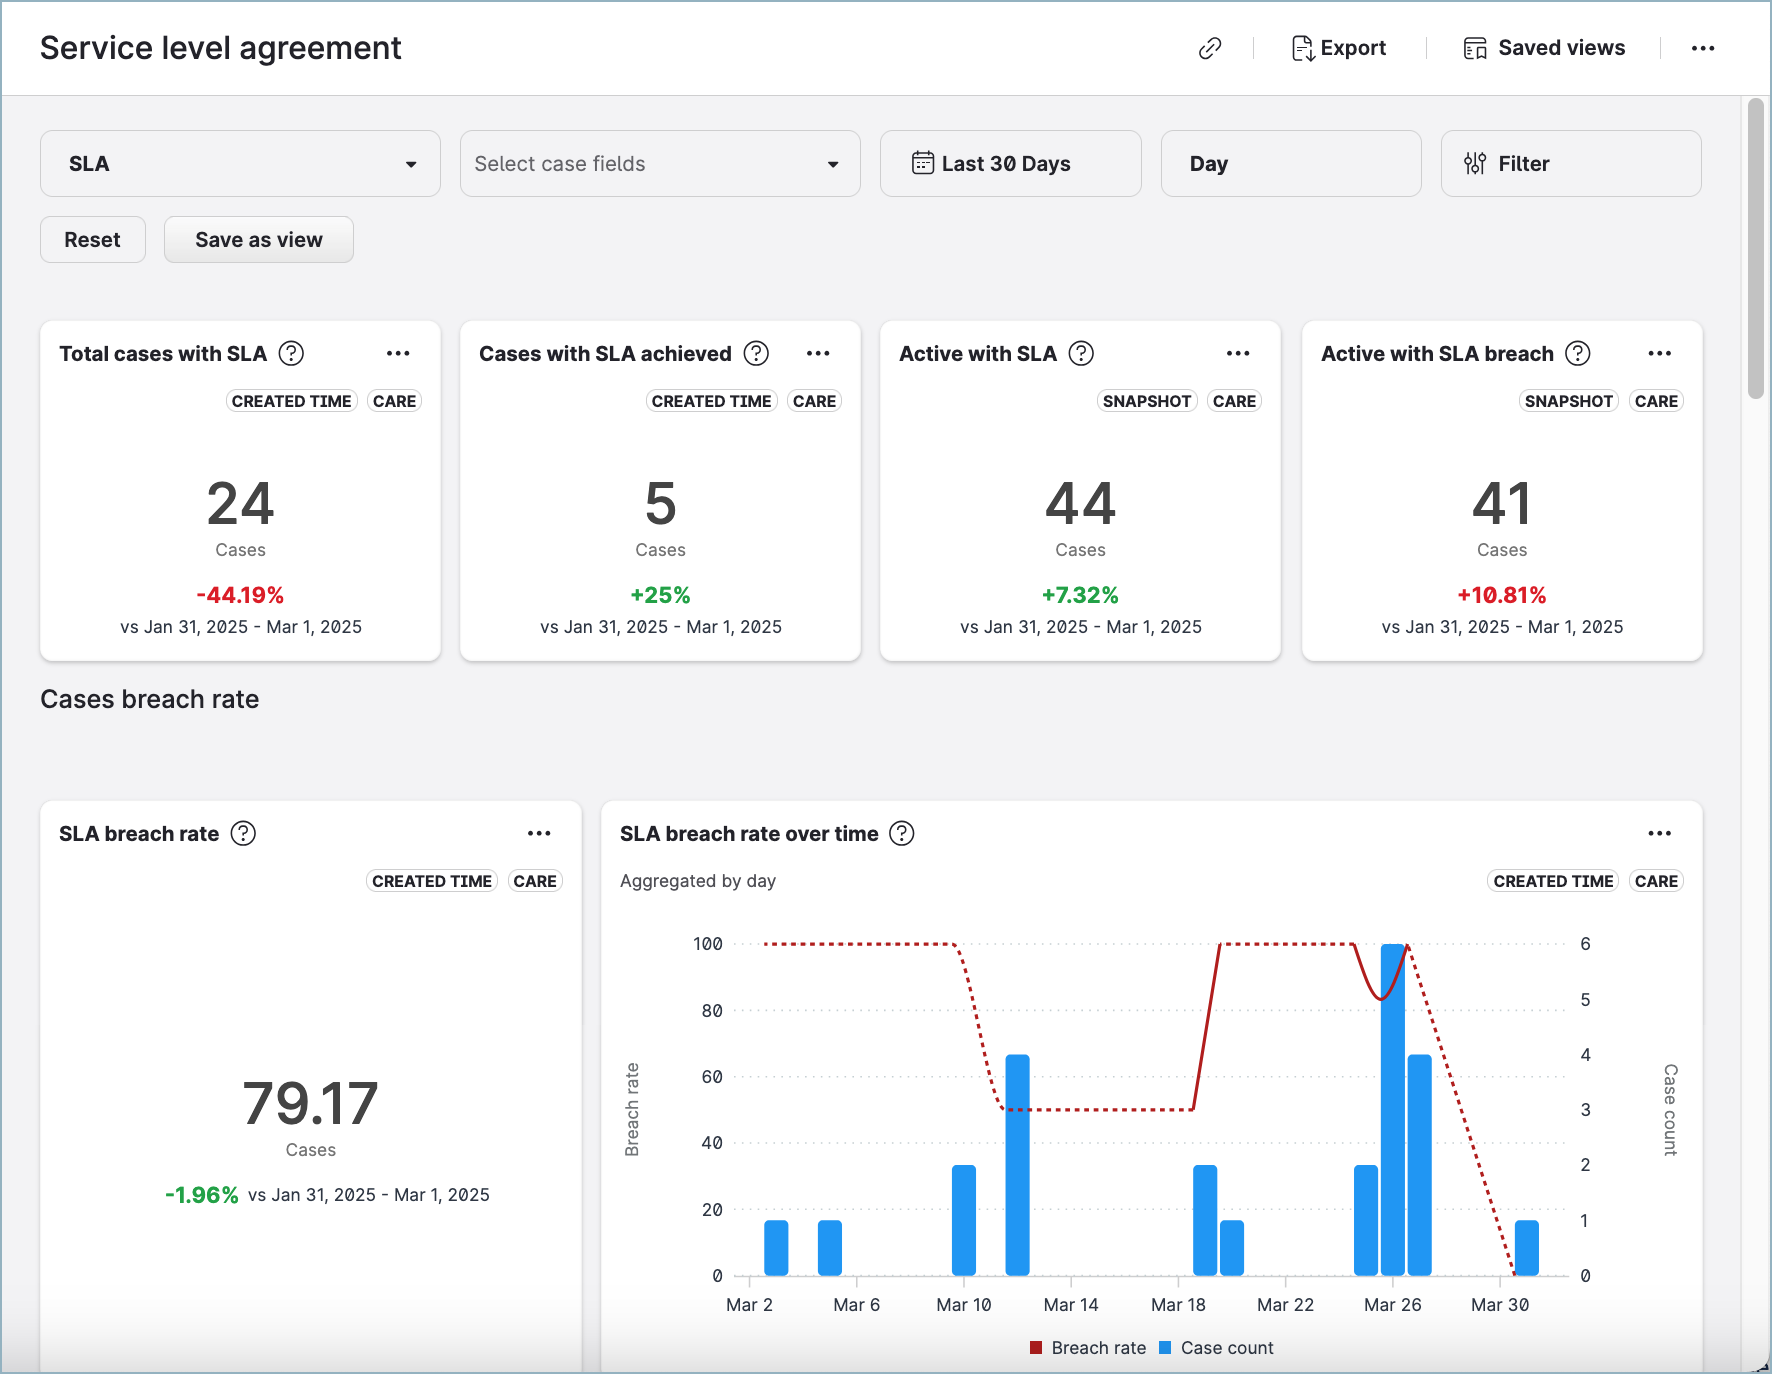
Service level agreement board
The Service level agreement board allows you to analyze response times and case resolution within SLA, and monitor and track SLA adherence for individual agents. The board displays widgets related to SLAs breached, SLAs met, SLA miss rate, completion time, breach time, and more.
Data availability
Be aware of the following:
-
The data available on the Service agreement board is based on the Care cases created on April 1, 2025, the earliest. Data about the cases created before April 1, 2025, is not available on the board.
-
Deleted Care cases are not shown and not used in calculations.
The underlying data may be subject to changes during the early access period.
Understand the board data
Metrics
The source of data for the board are the following metrics:
-
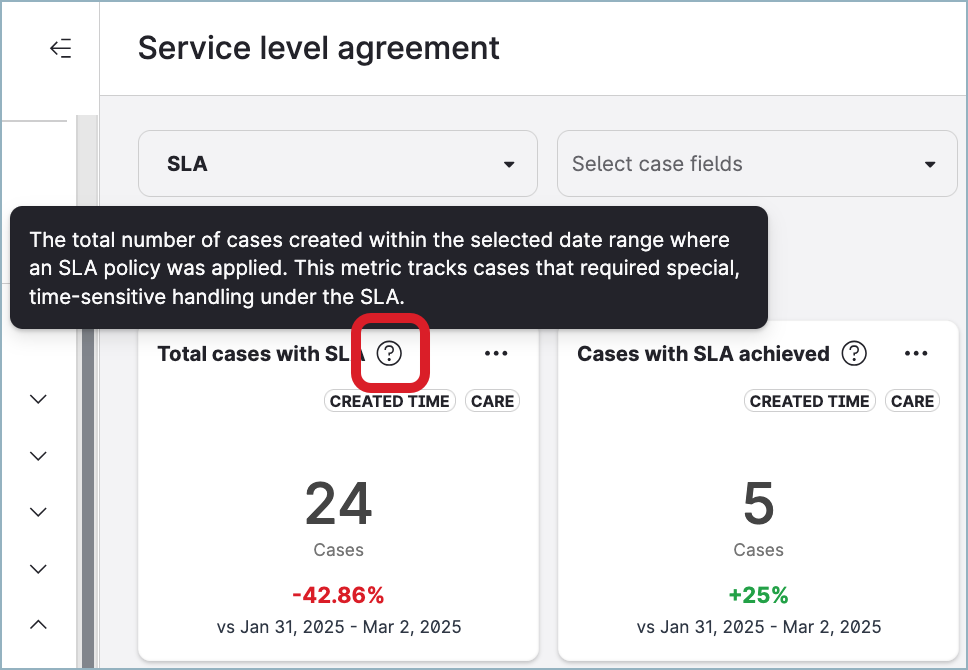
Total cases with SLA
-
Cases with SLA achieved
-
Active cases with SLA
-
Active cases with SLA breach
Widgets
The board comes with a set of pre-defined widgets based on the metrics, such as breach rate broken down by hour of the day, average SLA completion date, distribution of cases with SLA achieved/breached over time, and many more.
Each widget has a tooltip with a comprehensive explanation of what data it shows and any additional details that you may need to interpret the data correctly.
Filters
To get more specific results, you can apply additional filters to the board:
-
Channel
-
Platform
-
Language
-
Sentiment
-
Priority
-
Care agent[2]
-
User group
[2] Filtering by Care agent reflects the contribution of each agent involved in resolving the cases. Case attribution to agents depends on the data attribution type of an individual widget (for more information about the data attribution, see further in this article):
-
Created time: The agent currently assigned to the case
-
Milestone closed: The agent who was assigned to the case when the milestone was completed
-
Snapshot: The agent who was assigned to the case at end of the selected time range
Data attribution
Data attribution helps you understand how specific data points are categorized and visualized based on their relevance to different timeframes. By assigning data to specific timestamps or events, data attribution provides clarity and consistency of the metrics.
Data attribution can correspond to a specific event in the lifecycle of a Care case (when it was created/reopened/resolved) or what the state of a Care case was at a given point in time (snapshot). The widgets of the Service level agreement board use the following types of data attribution:
-
Created time
Care cases are attributed to the date/time when they were created (regardless of subsequent actions), within a specific time range. For example, all replies linked to a case are aggregated and attributed to the case’s creation time; this includes replies that occurred both during the time range and after the time range, consolidating them under the original creation timestamp. -
Milestone breached
-
Breach events (SLA milestones that started breaching within a specific time range) are attributed to the date/time when they exceeded the target timeframe and to the agent assigned when the milestone was breached.
-
Active breaches (SLA milestones that are running at the end of a specific time range as breached/not closed yet and are assigned to an agent at that time) are attributed to the date/time when the breach timer started running and to the agent assigned at the end of the time range. When filtered to “Today”, active breaches reflect the current number of Care cases with breached SLA that may need an action from Care agents.
-
-
Milestone closed
SLA milestones are attributed to the date/time when they were last closed (for example, case assigned, response sent, case resolved), within a specific time range. If a milestone was reactivated, the data reflects its most recent closure, even if it had previously been closed before the selected time range. This ensures that only the final closure state is considered, aligning with how milestones evolve over time. -
Snapshot
This attribution type provides a static view of data at the end of a specific time range or time intervals (hour, day, week, month) for widgets displaying trends in time. It disregards when Care cases were created, reopened, or resolved, offering a "moment-in-time" perspective, which is particularly valuable for identifying trends, auditing, and maintaining a consistent historical record.
The widgets use badges to indicate the attribution type they employ to simplify data interpretation:
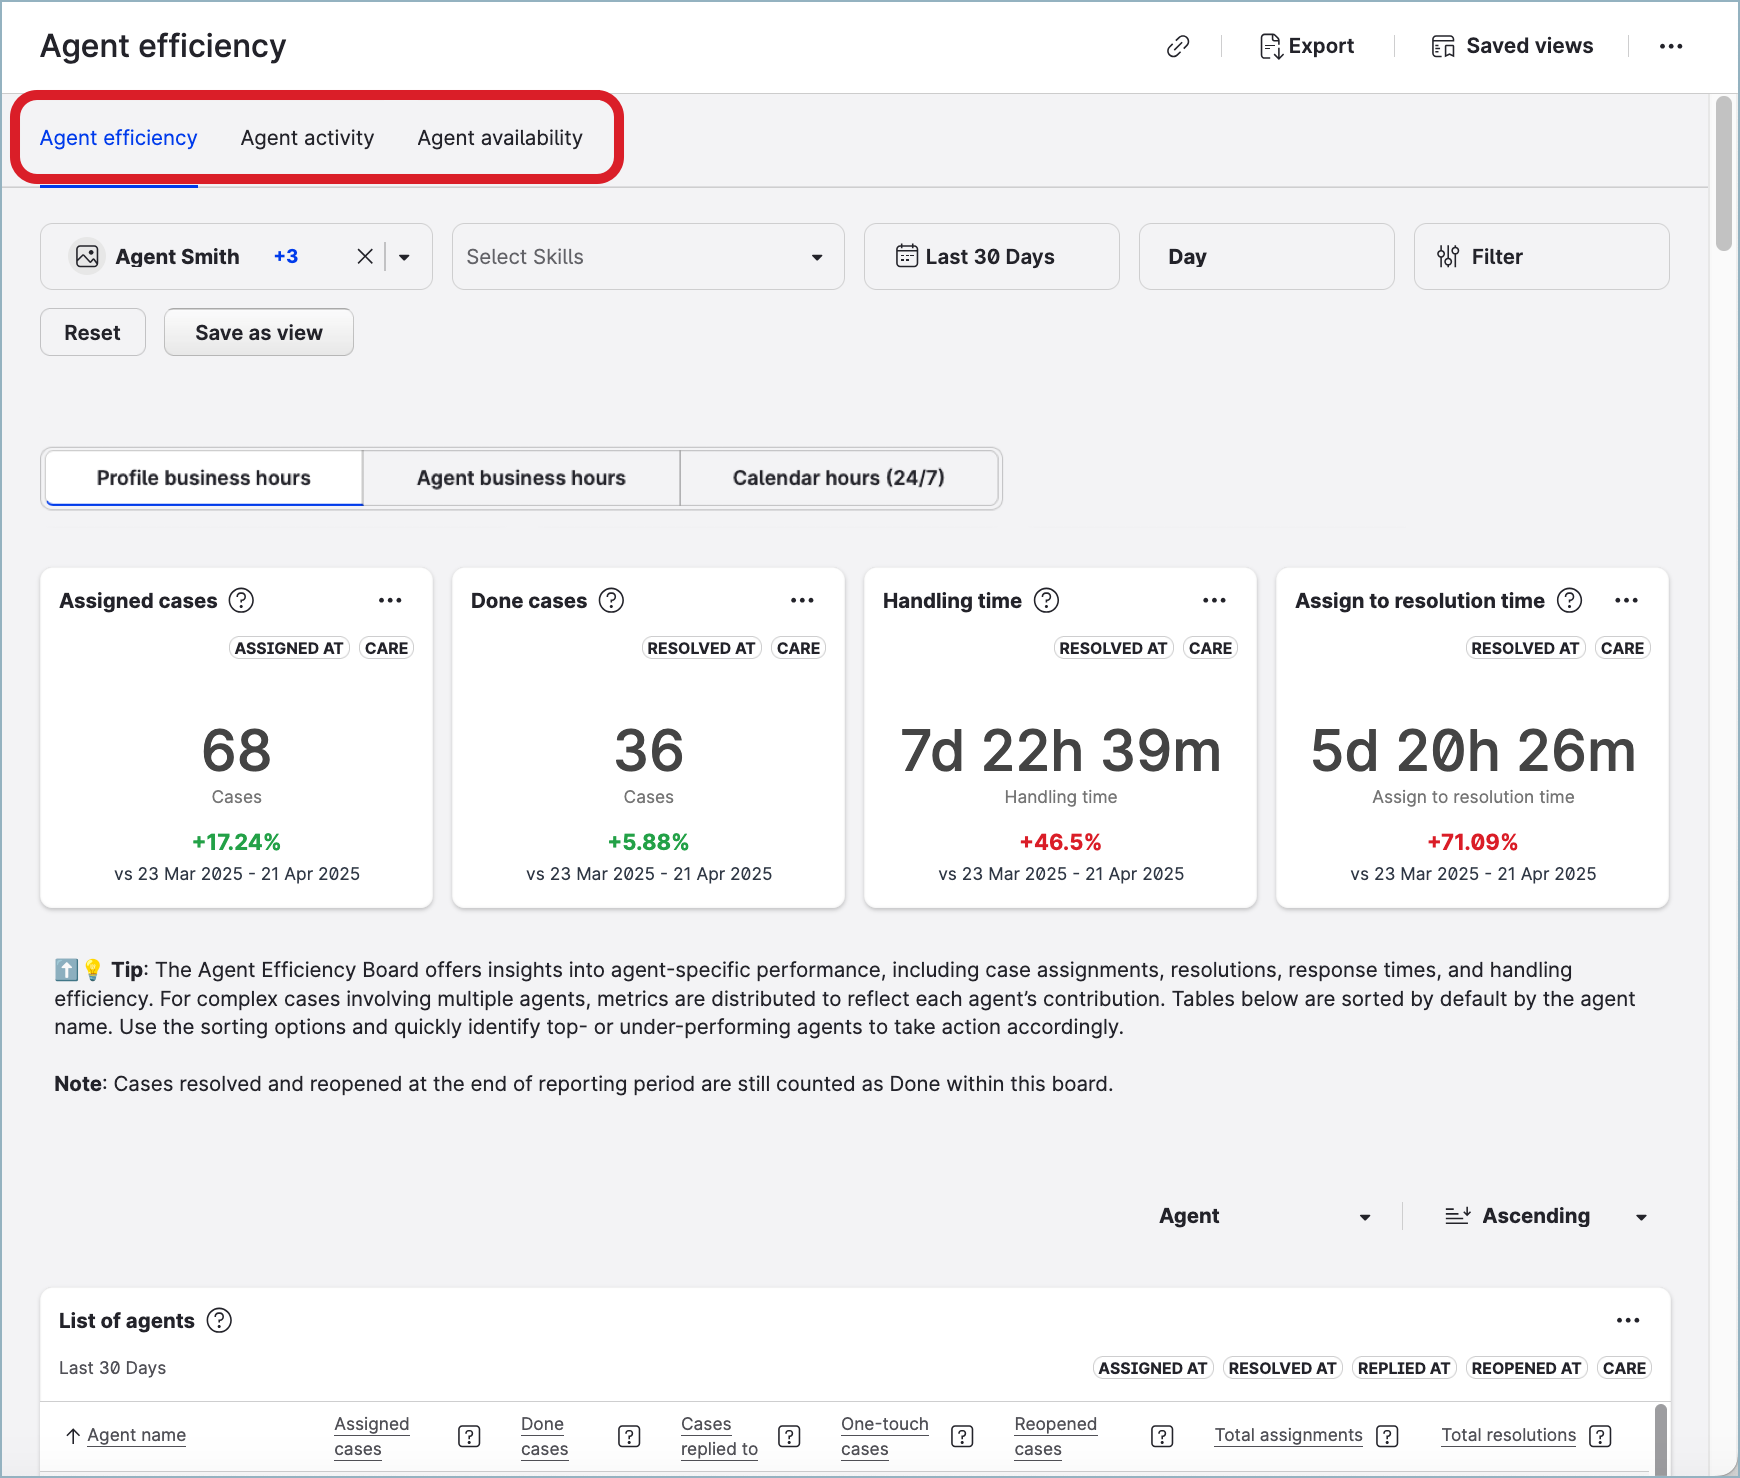
Agents performance
The Agents performance board allows you to assess the performance and availability of individual agents, and compare the performance of agents against one another.
The board has the following tabs:
-
Agent efficiency displays the volume of assigned cases and the agents' efficiency in resolving these cases, and lets you compare the performance of agents against one another.
-
Agent activity measures overall agents' engagement through the number of messages and comments sent.
-
Agent availability provides agents' availability live and throughout the day.
Data availability
Be aware of the following:
-
On the Agent efficiency tab:
-
The data behind the case-related metrics (such as the number of assigned cases, done cases, one-touch cases, and so on) is based on the Care cases created on November 1, 2024, the earliest.
-
The data behind the time-related metrics (such as handling time, response time, assign-to-resolution time, and so on) is based on the Care cases created on April 1, 2025, the earliest.
-
-
On the Agent activity tab, the available data is based on the Care cases created on November 1, 2024, the earliest. Data about the cases created before November 1, 2024, is not available on the tab.
The data for the period from November 1, 2024, till May 15, 2025, may be incomplete. Therefore, to get the most accurate results, we recommend that you set the time range on the Agent activity tab to start on May 15, 2025, the earliest.
-
On the Agent availability tab, the available data is based on the history of Care agents' statuses starting November 14, 2024. Data about the statuses before November 14, 2024, is not available on the tab.
-
Deleted Care cases are not shown and not used in calculations.
The underlying data may be subject to changes during the early access period.
Understand the board data
Selecting a Care agent
To start analyzing, select one or more Care agents and/or user groups on top of the tab. Case attribution to agents depends on the data attribution type of an individual widget (for more information about the data attribution, see further in this article):
-
Assigned at: The agent assigned to the Care case within the time range set for the board
-
Replied at: The agent who sent the reply or took a specific action within the Care case (for example, hid or deleted a message, added an internal note)
-
Resolved at: The agent who was assigned to the case when the case was resolved
-
Reopened at: The agent who was assigned to the case when the case was reopened
-
Snapshot: The agent who was assigned to the case at end of the selected time range
Metrics
The source of data for the board are the following metrics:
-
Assigned cases
-
Replied cases
-
Actions taken by Care agents
Widgets
The board comes with a set of pre-defined widgets based on the metrics, such as the number of assigned/resolved/reopened/one-touch cases, response time, assign-to-resolution time, the number of replies sent, and many more.
Each widget has a tooltip with a comprehensive explanation of what data it shows and any additional details that you may need to interpret the data correctly.
Filters
To get more specific results, you can apply additional filters to the board:
-
Channel
-
Case field
-
Platform
-
Language
-
Sentiment
-
Priority
Data attribution
Data attribution helps you understand how specific data points are categorized and visualized based on their relevance to different timeframes. By assigning data to specific timestamps or events, data attribution provides clarity and consistency of the metrics.
Data attribution can correspond to a specific event in the lifecycle of a Care case (when it was created/reopened/resolved), what the state of a Care case was at a given point in time (snapshot), or what status a Care agent had at a specific moment or within a specific time range. The widgets of the Agents performance board use the following types of data attribution:
-
Assigned at
Care cases are attributed to the date/time when they were assigned to a Care agent, within a specific time range. This attribution type tracks for how long the agent was assigned to a case regardless of when the case was created or resolved. -
Replied at
Care cases are attributed to the date/time when replies were sent to customers or specific actions (for example, message deleted or hidden, internal note added) were taken within the cases, within a specific time range. This attribution type tracks agent or system responses/actions regardless of when the case was created or resolved, showing communication activity tied to the response timestamps. -
Resolved at
Care cases are attributed to the date/time when they were resolved (transitioned to the status ofDoneorSpam), within a specific time range.-
For the Handling time metric and the Assign-to-resolution time metric, this attribution type counts only the cases that were resolved during the specified time range and remained resolved till the end of it. It captures the last time a case was resolved within the time range and includes cases created before the time range.
-
For the Done cases metric, this attribution type counts both the cases that remained resolved till the end of the specified time range and the cases that were reopened before the end of it.
-
-
Reopened at
Care cases are attributed to the date/time when they were reopened (transitioned from the status ofDoneorSpamtoNew,Open,Pending, orOn hold), within a specific time range. This attribution type highlights situations where cases require additional attention after they have been resolved and provides visibility into recurring issues or rework demands. -
Snapshot
This attribution type provides a static view of data at the end of a specific time range or time intervals (hour, day, week, month) for widgets displaying trends in time. It disregards when Care cases were created, reopened, or resolved, offering a "moment-in-time" perspective, which is particularly valuable for identifying trends, auditing, and maintaining a consistent historical record. -
Agent status
This attribution type shows data based on the status of Care agents (online/away/offline; see Control Your Online Presence and Status in Care) at a specific moment or within a specific time range.
The widgets use badges to indicate the attribution type they employ to simplify data interpretation:
Dynamic boards
In addition to the preset boards described above, Unified Analytics allows you to create fully customized Care reporting views using dynamic boards. Dynamic boards give you complete control over the content and layout of your analysis.
Currently, dynamic boards in Unified Analytics are available to the participants of our early access program. If you do not participate in that program, contact your CSM about customization options and creating your own Unified Analytics boards and they will create a board for you.
You can build widgets for dynamic boards in two ways: