Scientific Notation in Data Visualizations
Your analysis may occasionally result in your charts displaying values smaller than 0.01.
Displaying such values, along with the % (percentage) sign within the constraints of axis of bar and pie charts would not be plausible.
For visual brevity, values with three decimal places or more are displayed using scientific notation.
For example:
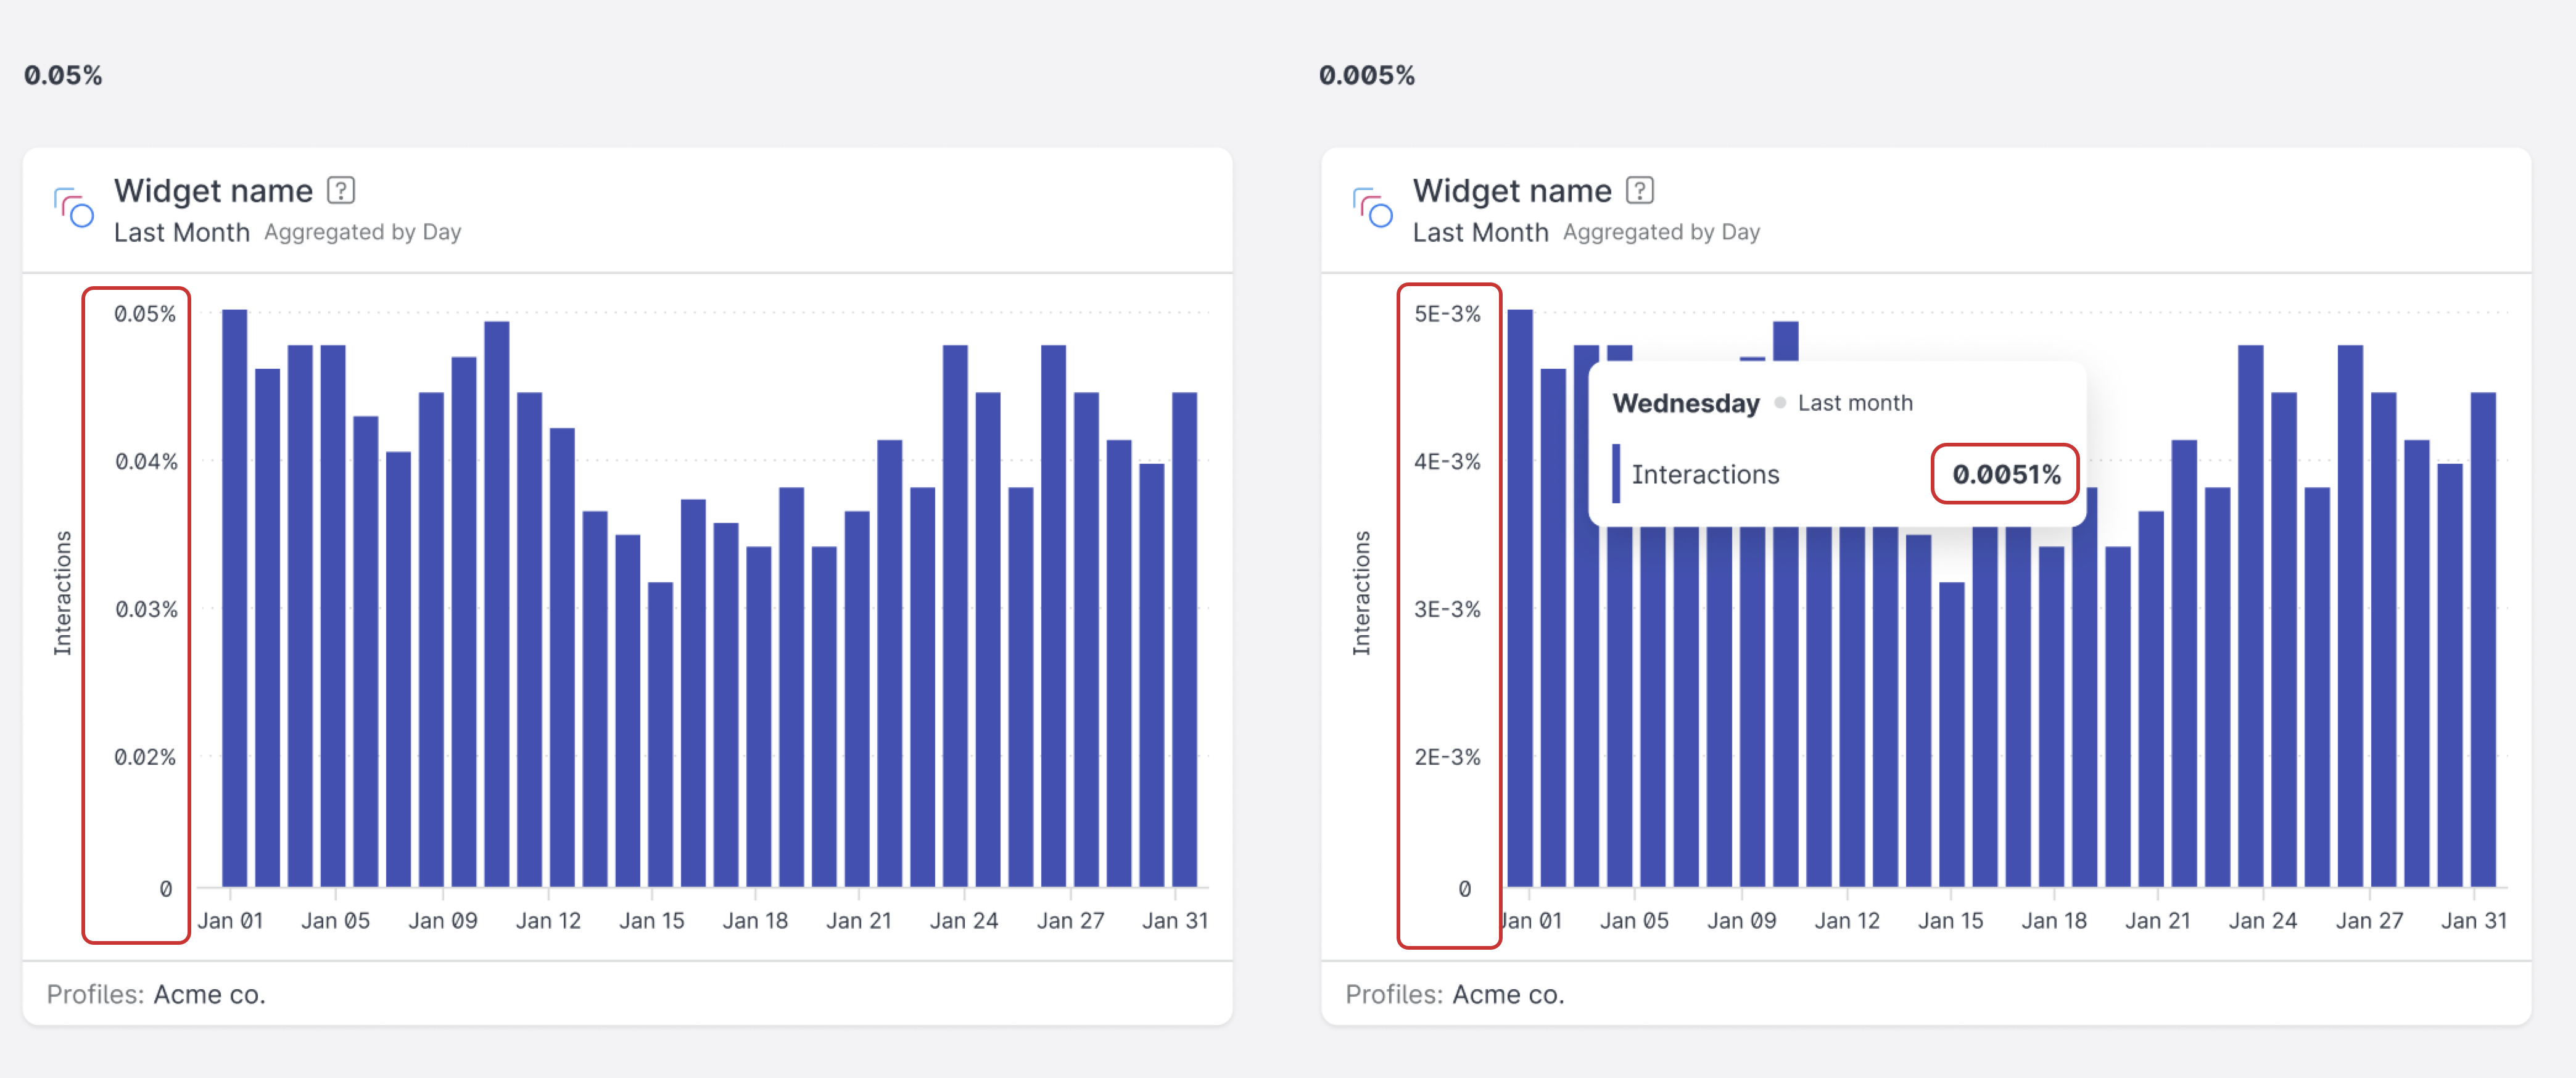
0.005% will be displayed as 5E-3%
0.005 will be displayed as 5E-3
The plain-format exact numeric value in is shown in the detail view for individual bars and as a tool tip on the axis markings.