Analyze and Report on Your Instagram Performance
Legacy Analytics has been deprecated as of November 13, 2024. It’s been replaced by the Unified Analytics module. To learn more, see Unified Analytics Transition Best Practices.
With Instagram boasting 1 billion active users, brands are refocusing their efforts and budget to more deeply engage with audiences there. To help marketers work smarter, we’ve added private profile level metrics of Impressions, Reach, Profile Views, and Website Clicks alongside Instagram public metrics in Emplifi Suite.
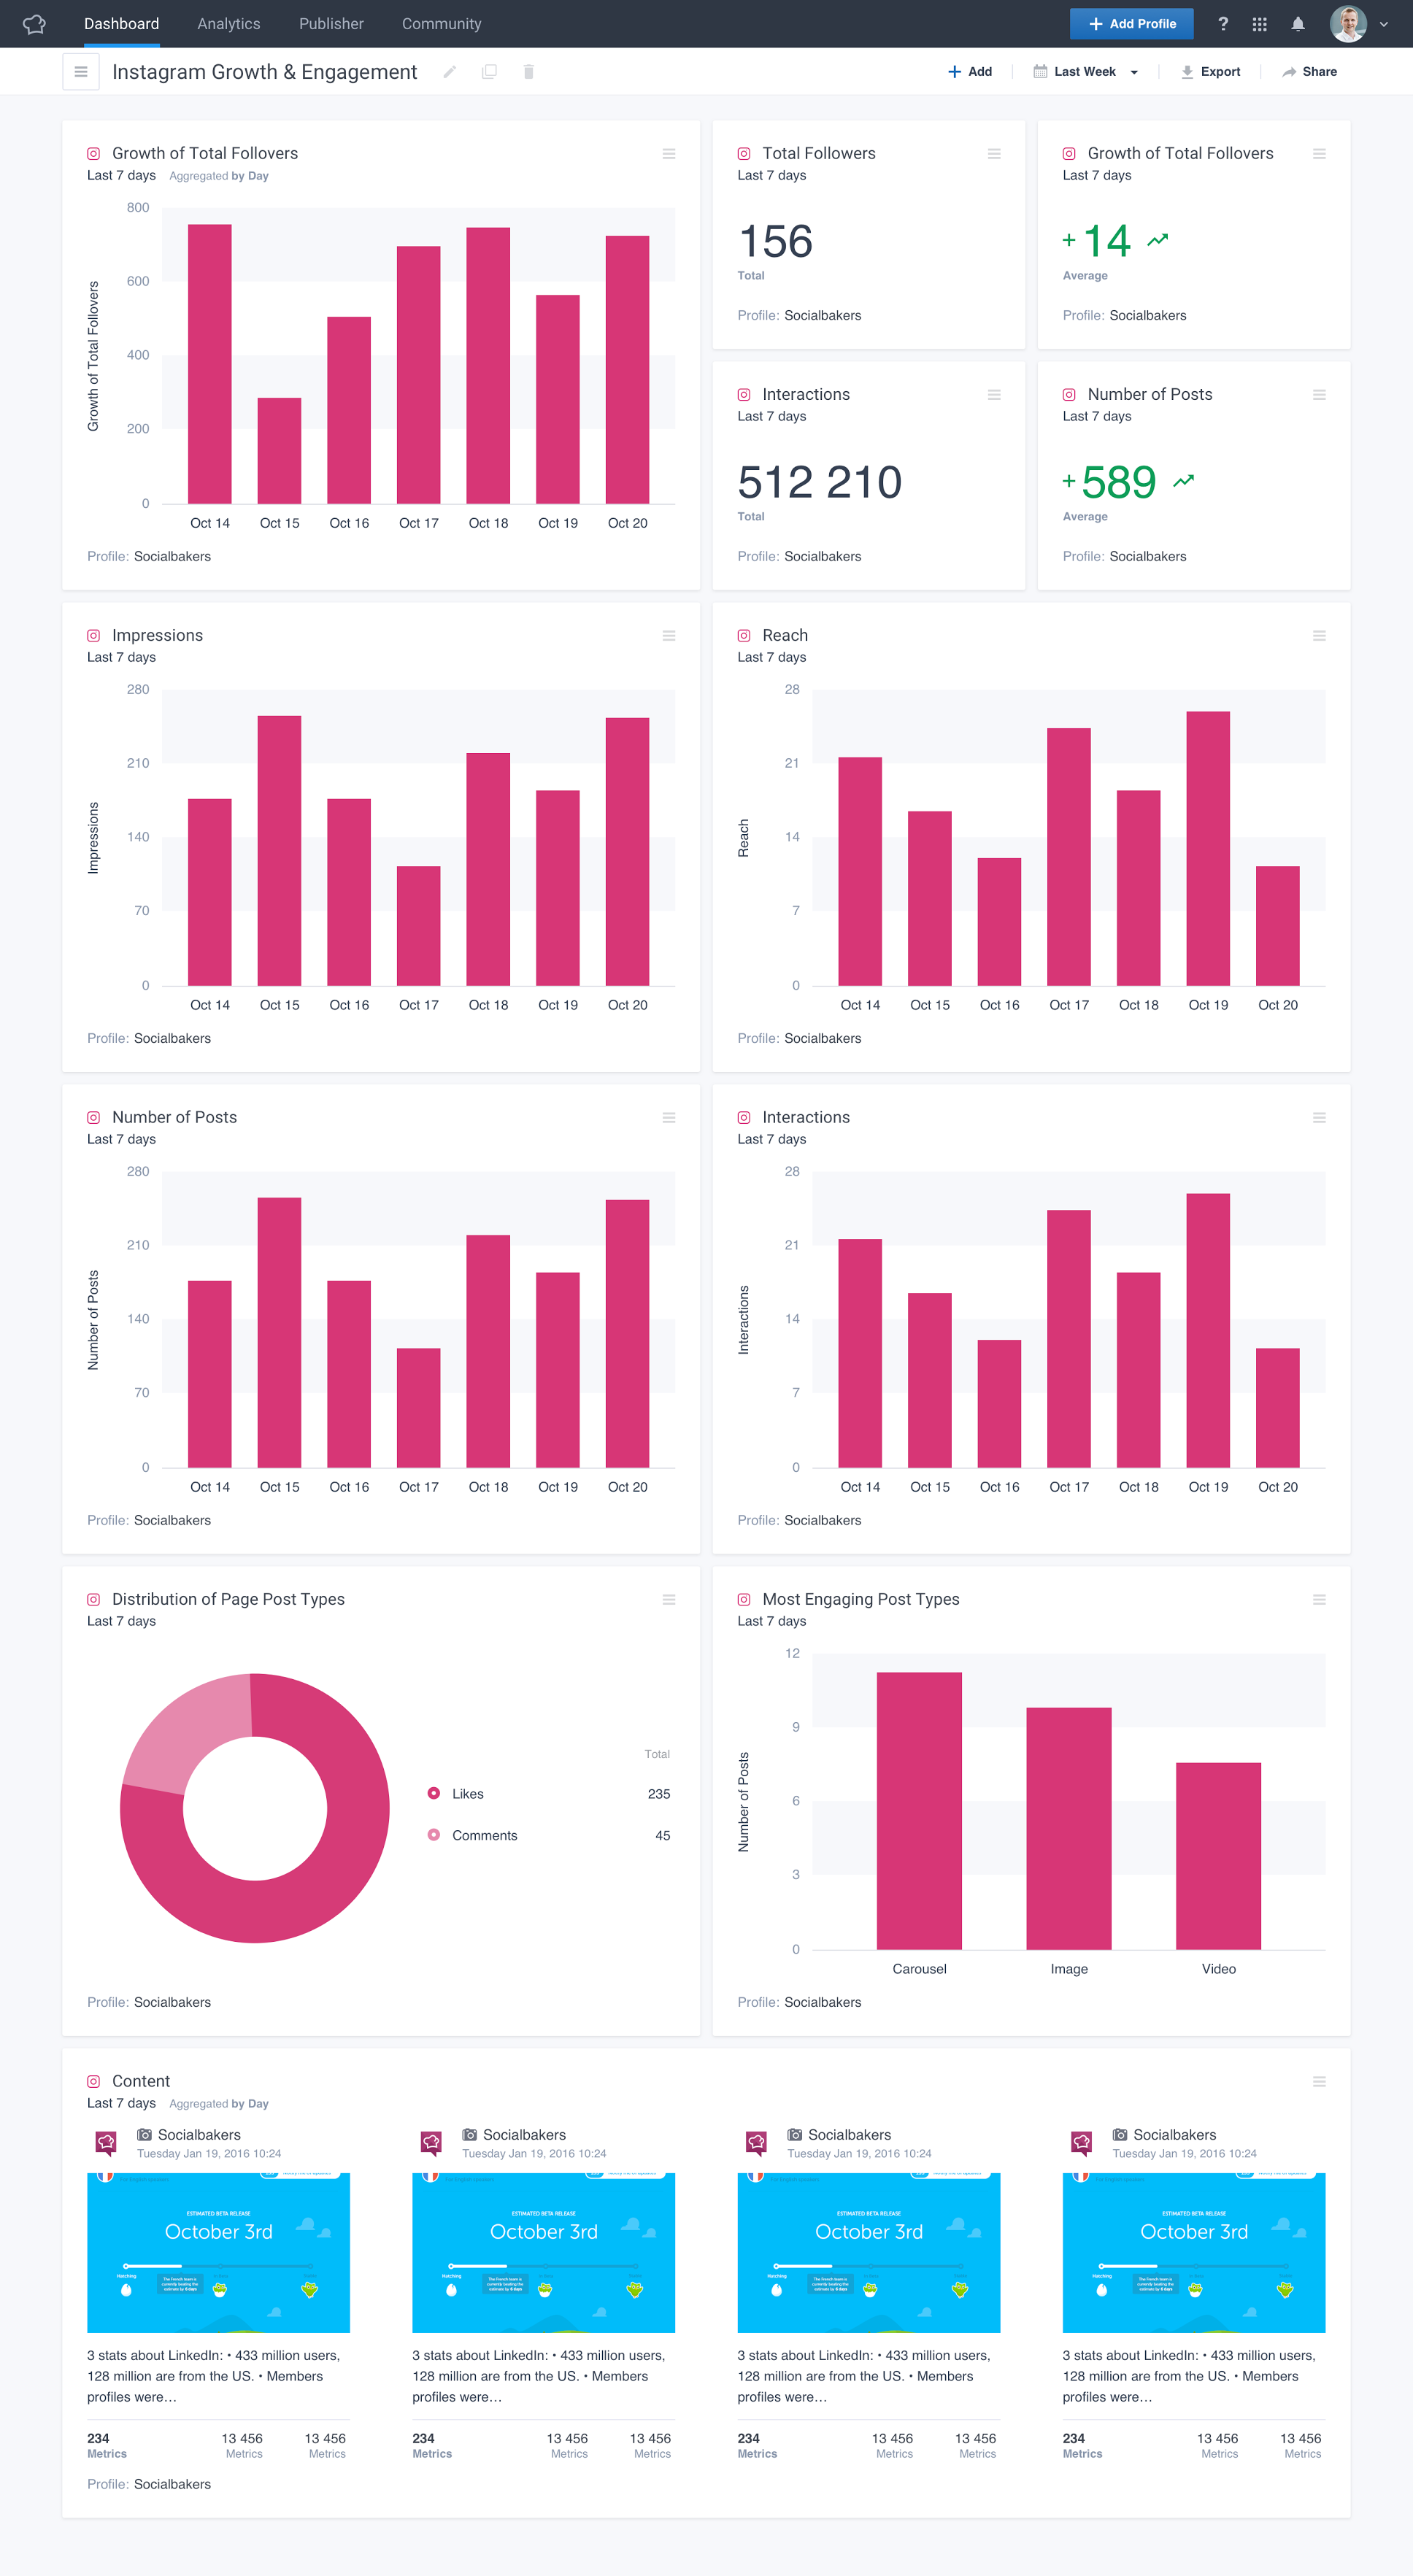
Instagram Dashboard in Emplifi Suite
Dashboard’s all-in-one overview provides you with the convenience to report more efficiently - you can export a comparative view of all your Instagram profiles along all the KPIs of your choice in one report. Easily gather insights, communicate your results, share them with your teams, and optimize your social media content strategy with smart, data-driven decisions.
Activate Instagram Insights
Instagram Insights data is available only for Instagram Business profiles - meaning that the Instagram profile needs to be linked to a Facebook company Page. If you do not have an Instagram business profile, here's how you can easily create it.
To enable your Instagram Insights so you can monitor them in Dashboard, go to the Settings section of Suite. Connect your Insights by going to Settings -> Channels -> Social profiles, selecting your profile, and connecting the Instagram Insights permission. You can now go back to Dashboard and add the widgets to display your Instagram private metrics. In one view, you will be able see all the most important KPIs: Impressions, Reach, Profile Views, and Website Clicks.
Metrics available for Instagram
You can measure and report on the following metrics with easily customizable widgets:
Public metrics - compare these against any of your competitors’ pages: Followers Growth, Total Followers, Interactions, Number of Posts, Most Engaging Post Type, Distribution of post Types, Top Content.
Private metrics - report the performance of your managed Instagram profiles
Impressions
Total number of times your posts and stories were viewedReach
Number of unique accounts who viewed your posts and stories. Reach might be lower than Impressions since one person can receive multiple Impressions.Website Clicks
Total number of clicks to links you've included in your business profile description.Profile Views
Number of unique accounts who have visited your business profile.
Create your first Instagram Dashboard and analyze your results
Make sure to read and communicate your results in an easy and understandable way. There are numerous insights you can take from the data which will help you to answer following questions:
Am I growing my audience?
Check the Total Fans and Growth of Total Followers widgets. Building an active large followership on Instagram is important, as it will drive your engagement. Look at the peaks in the Followers Growth and identify campaigns and posts causing spikes in growth.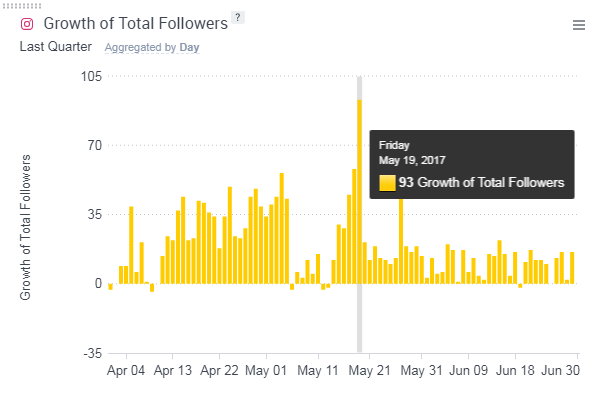
If your followers are not growing, consider building campaigns with influencers to mention your brand in their stories with a call-to-action to follow your brand, or create a hashtag competition and campaigns that include Instagram. Struggling with campaign ideas? Go to the Inspiration section to find out what kind of content is resonating on Instagram right now.
Is my content engaging?
Check the Number of Posts, Reach, Impressions, and Engagement widgets side by side to see if you are reaching your audience and then your followers are actively engaging with your content. This is the true indicator of content quality.What should my content mix look like?
Look at your Distribution of Page Post Types and compare it to the Most Engaging Post Types to see if you should post more photos, videos or carousels. As those metrics are public, you can easily check what works for your competition and be inspired by their strategy, too. In the example below, this brand is posting more videos than carousels, although carousels are driving more engagement - a clear insight to tweak content strategy and post more carousels.
Does my content drive website traffic? Use the Website Clicks widget. If your numbers are low, make sure to check if you are regularly including web links in your business profile description and you are communicating it in the description of your published posts at the same time.
Which content is driving my engagement? Check the Top Content widget to see the most engaging posts.
Advanced Instagram tips
Save time and report more efficiently by comparing all of your social media profiles.
If you are administering more Instagram profiles, look at a side-by-side comparison of Reach, Impressions, and Page Views paired with engagement metrics to start building a comprehensive picture of which social media profiles are generating the most value. It will make it easy to view where you need to reconsider your social strategy and content quality.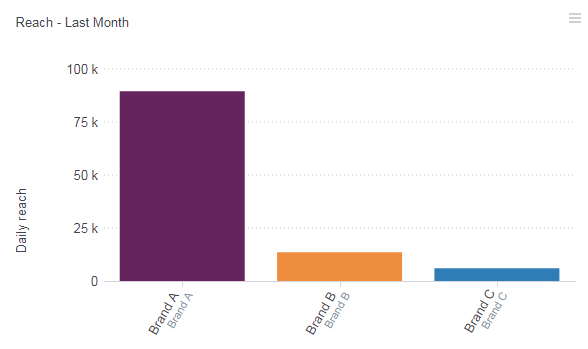
If your are administering dozens of profiles, you can label them by regions, product categories or other page labels of your choice and create a dashboard to compare larger samples of profiles against each other.
Understand which social media platforms are generating the most value.
With one Dashboard you can combine widgets from all the major social media platforms. Cross-compare engagement and number of posts on Instagram with Facebook, Pinterest, and Twitter to see how efficient particular platforms are.
These are just few tips how to make compelling Instagram reports. We hope they will make your reporting and analysis of your performance more convenient than ever before.