Unified Analytics
The Unified Analytics module allows you to see key metrics and insights from all the products and modules on the Emplifi platform. You can view Unified Analytics as a platform that display data for all of Emplifi products.
Unified Analytics comes with topical boards that are pre-loaded with hundreds of ready-made data visualization that will display your analyzed data the moment you connect your data sources, set up listening etc.
The widgets (your data visualizations) are not static. You can drill down, set time frame, and compare performance across multiple accounts on multiple platforms.
What’s available in Unified Analytics
Boards with widgets are organized in the following modules.
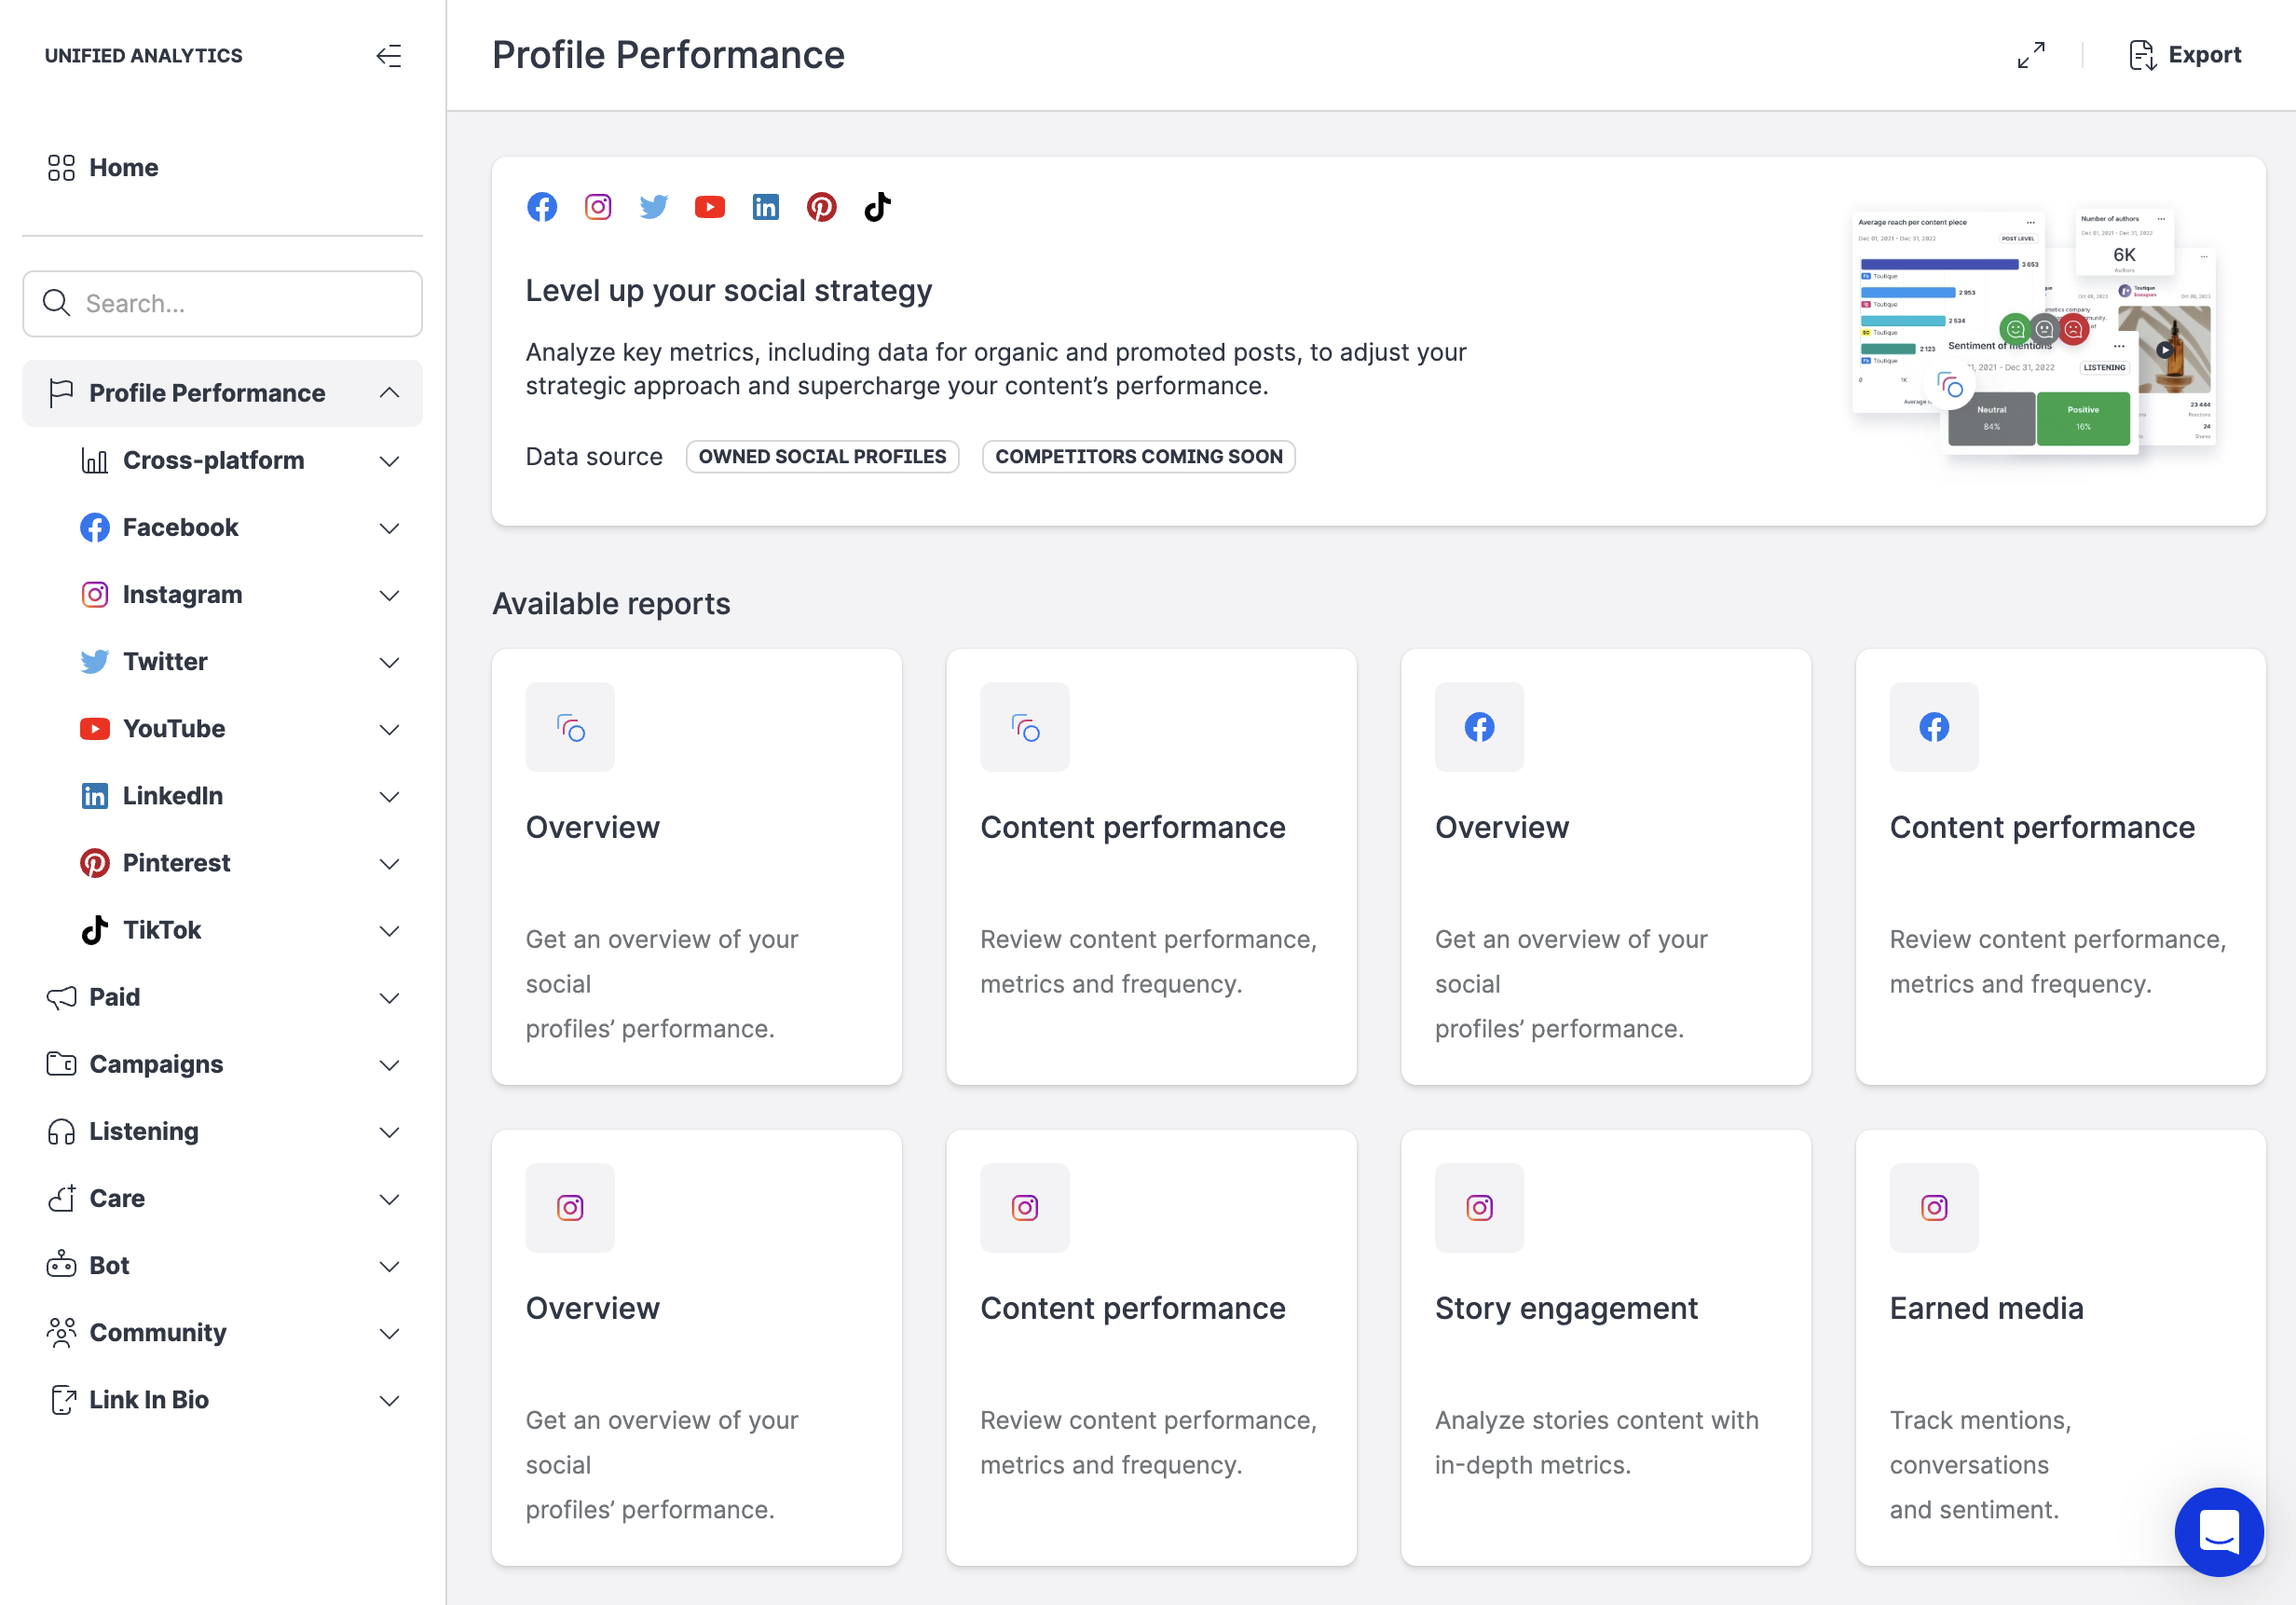
Profile performance
Use Profile performance boards for single-platform and cross-platform performance analyses.
Available data sources:
owned social profiles
Paid
Available data sources
AD accounts and campaigns
Campaigns & Labels
Available data sources:
content labels
Listening
Available data sources:
listening queries
Care
Available data sources:
activity of agents and supervisors
Bot
Bot unified analytics provides a streamlined way for you to see your bot traffic statistics, as well as deeper insights around its effectiveness with the conversations it has with your customers.
Available data sources:
bots
Community
Available data sources:
owned social profiles
listening queries
Live Commerce
Available data sources:
Live Advisor
Link in Bio
Available data source:
Coming soon
UGC
Ratings & Reviews
Influencers
Knowledge
Agent
For more information about available modules and boards, see Unified Analytics - List of Boards
Unified Analytics naming conventions
Module
A module is unit of dashboard defined by a high-level characteristics. For example, the Profile performance module is a home for cross-platform and social network-specific boards. The Care module focuses on Care analytics.
Board
A board is a workspace that displays widgets - visual representations of the underlying analytics.
For more information, see Unified Analytics - Boards Overview.
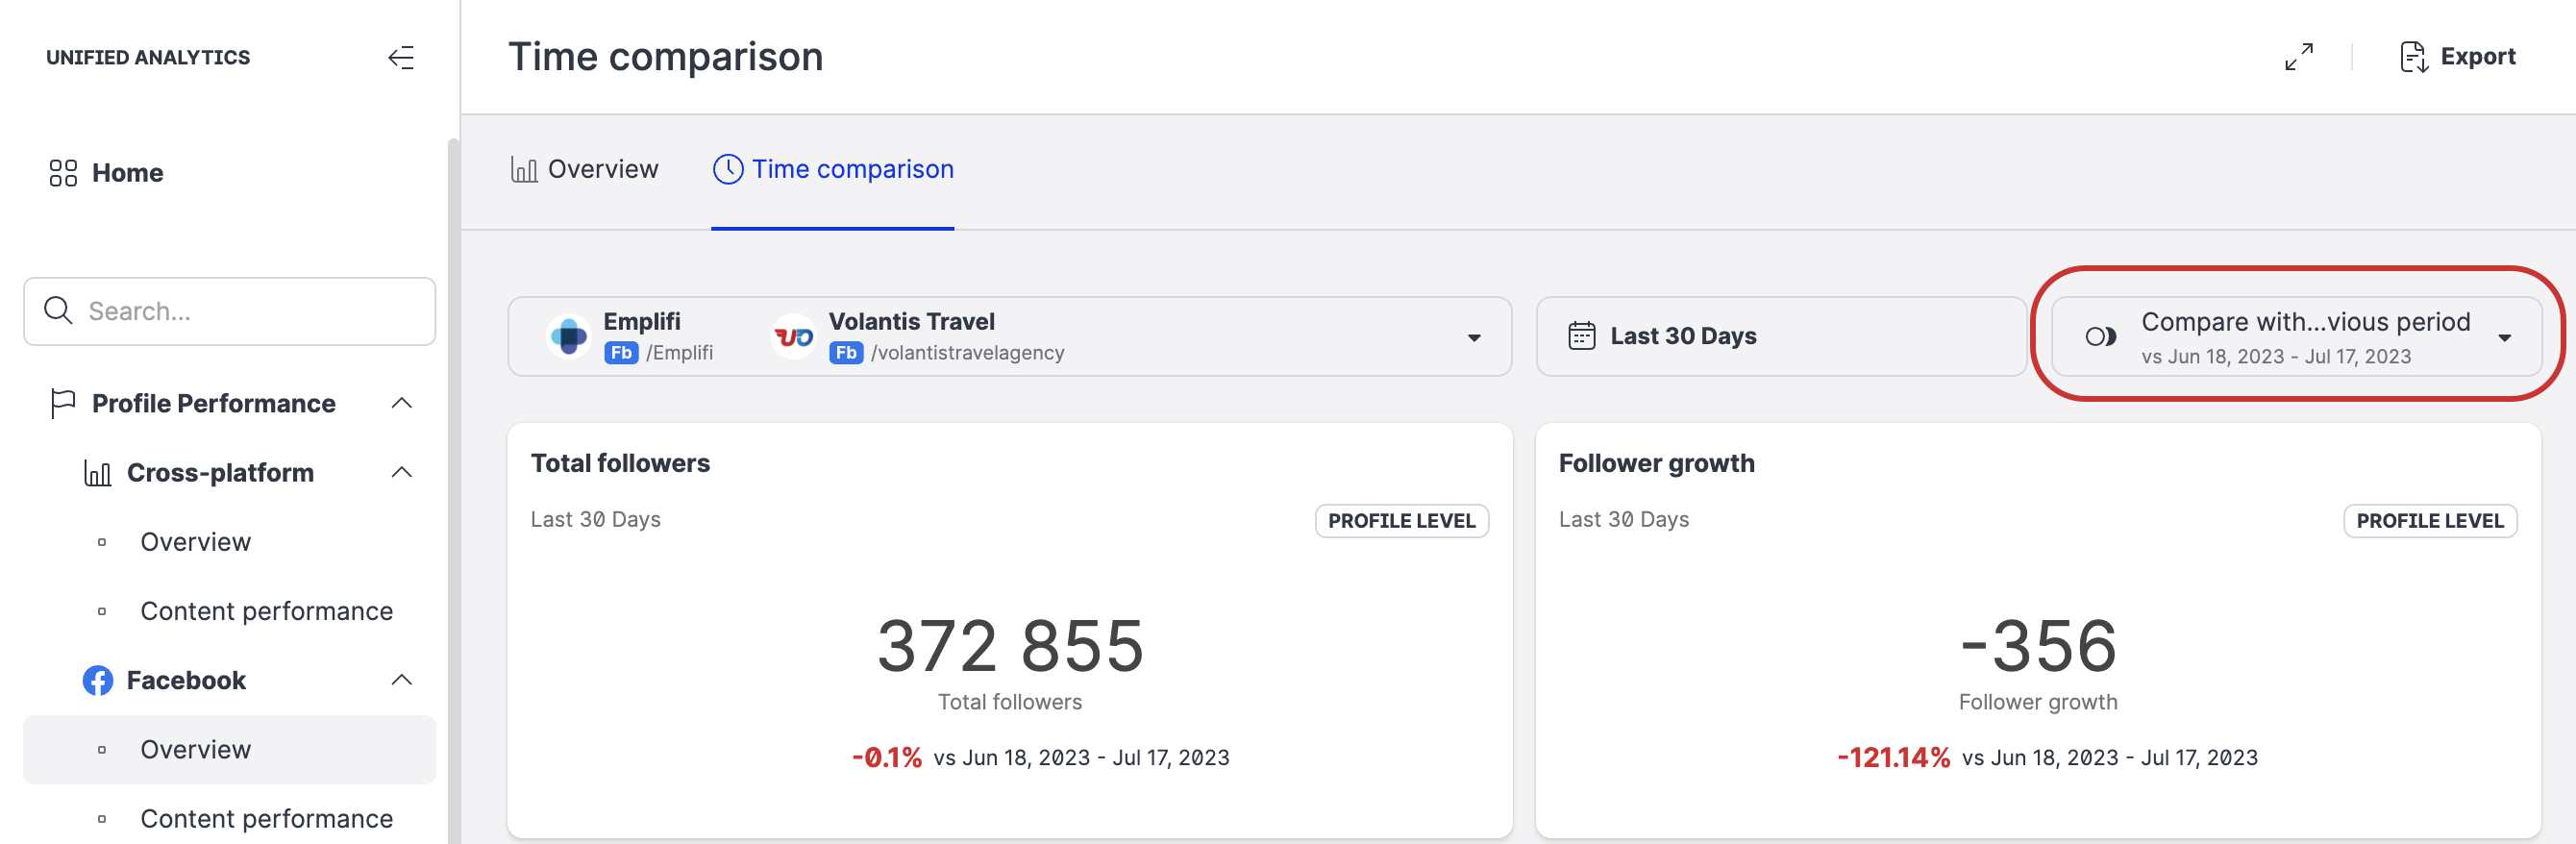
Control
A control is a tool that you use to define what a board or widget displays and/or how they behave. The following image highlights the time comparison range control.
Widget
A widget is a visual representation of underlying metrics that process data from selected data sources. Widgets are pre-defined (in terms of visualization type, size, and information display) and you do not have to set them up.
Some widgets are interactive and allow you to further explore the underlying data.
For more information, see Unified Analytics - Widgets Overview.