Unified Analytics - Boards Overview
A Unified Analytics board is a workspace that contains individual widgets displaying data visualizations.
In the following example, you see the list of boards that are available for the Profile performance module segmented by social media platforms.
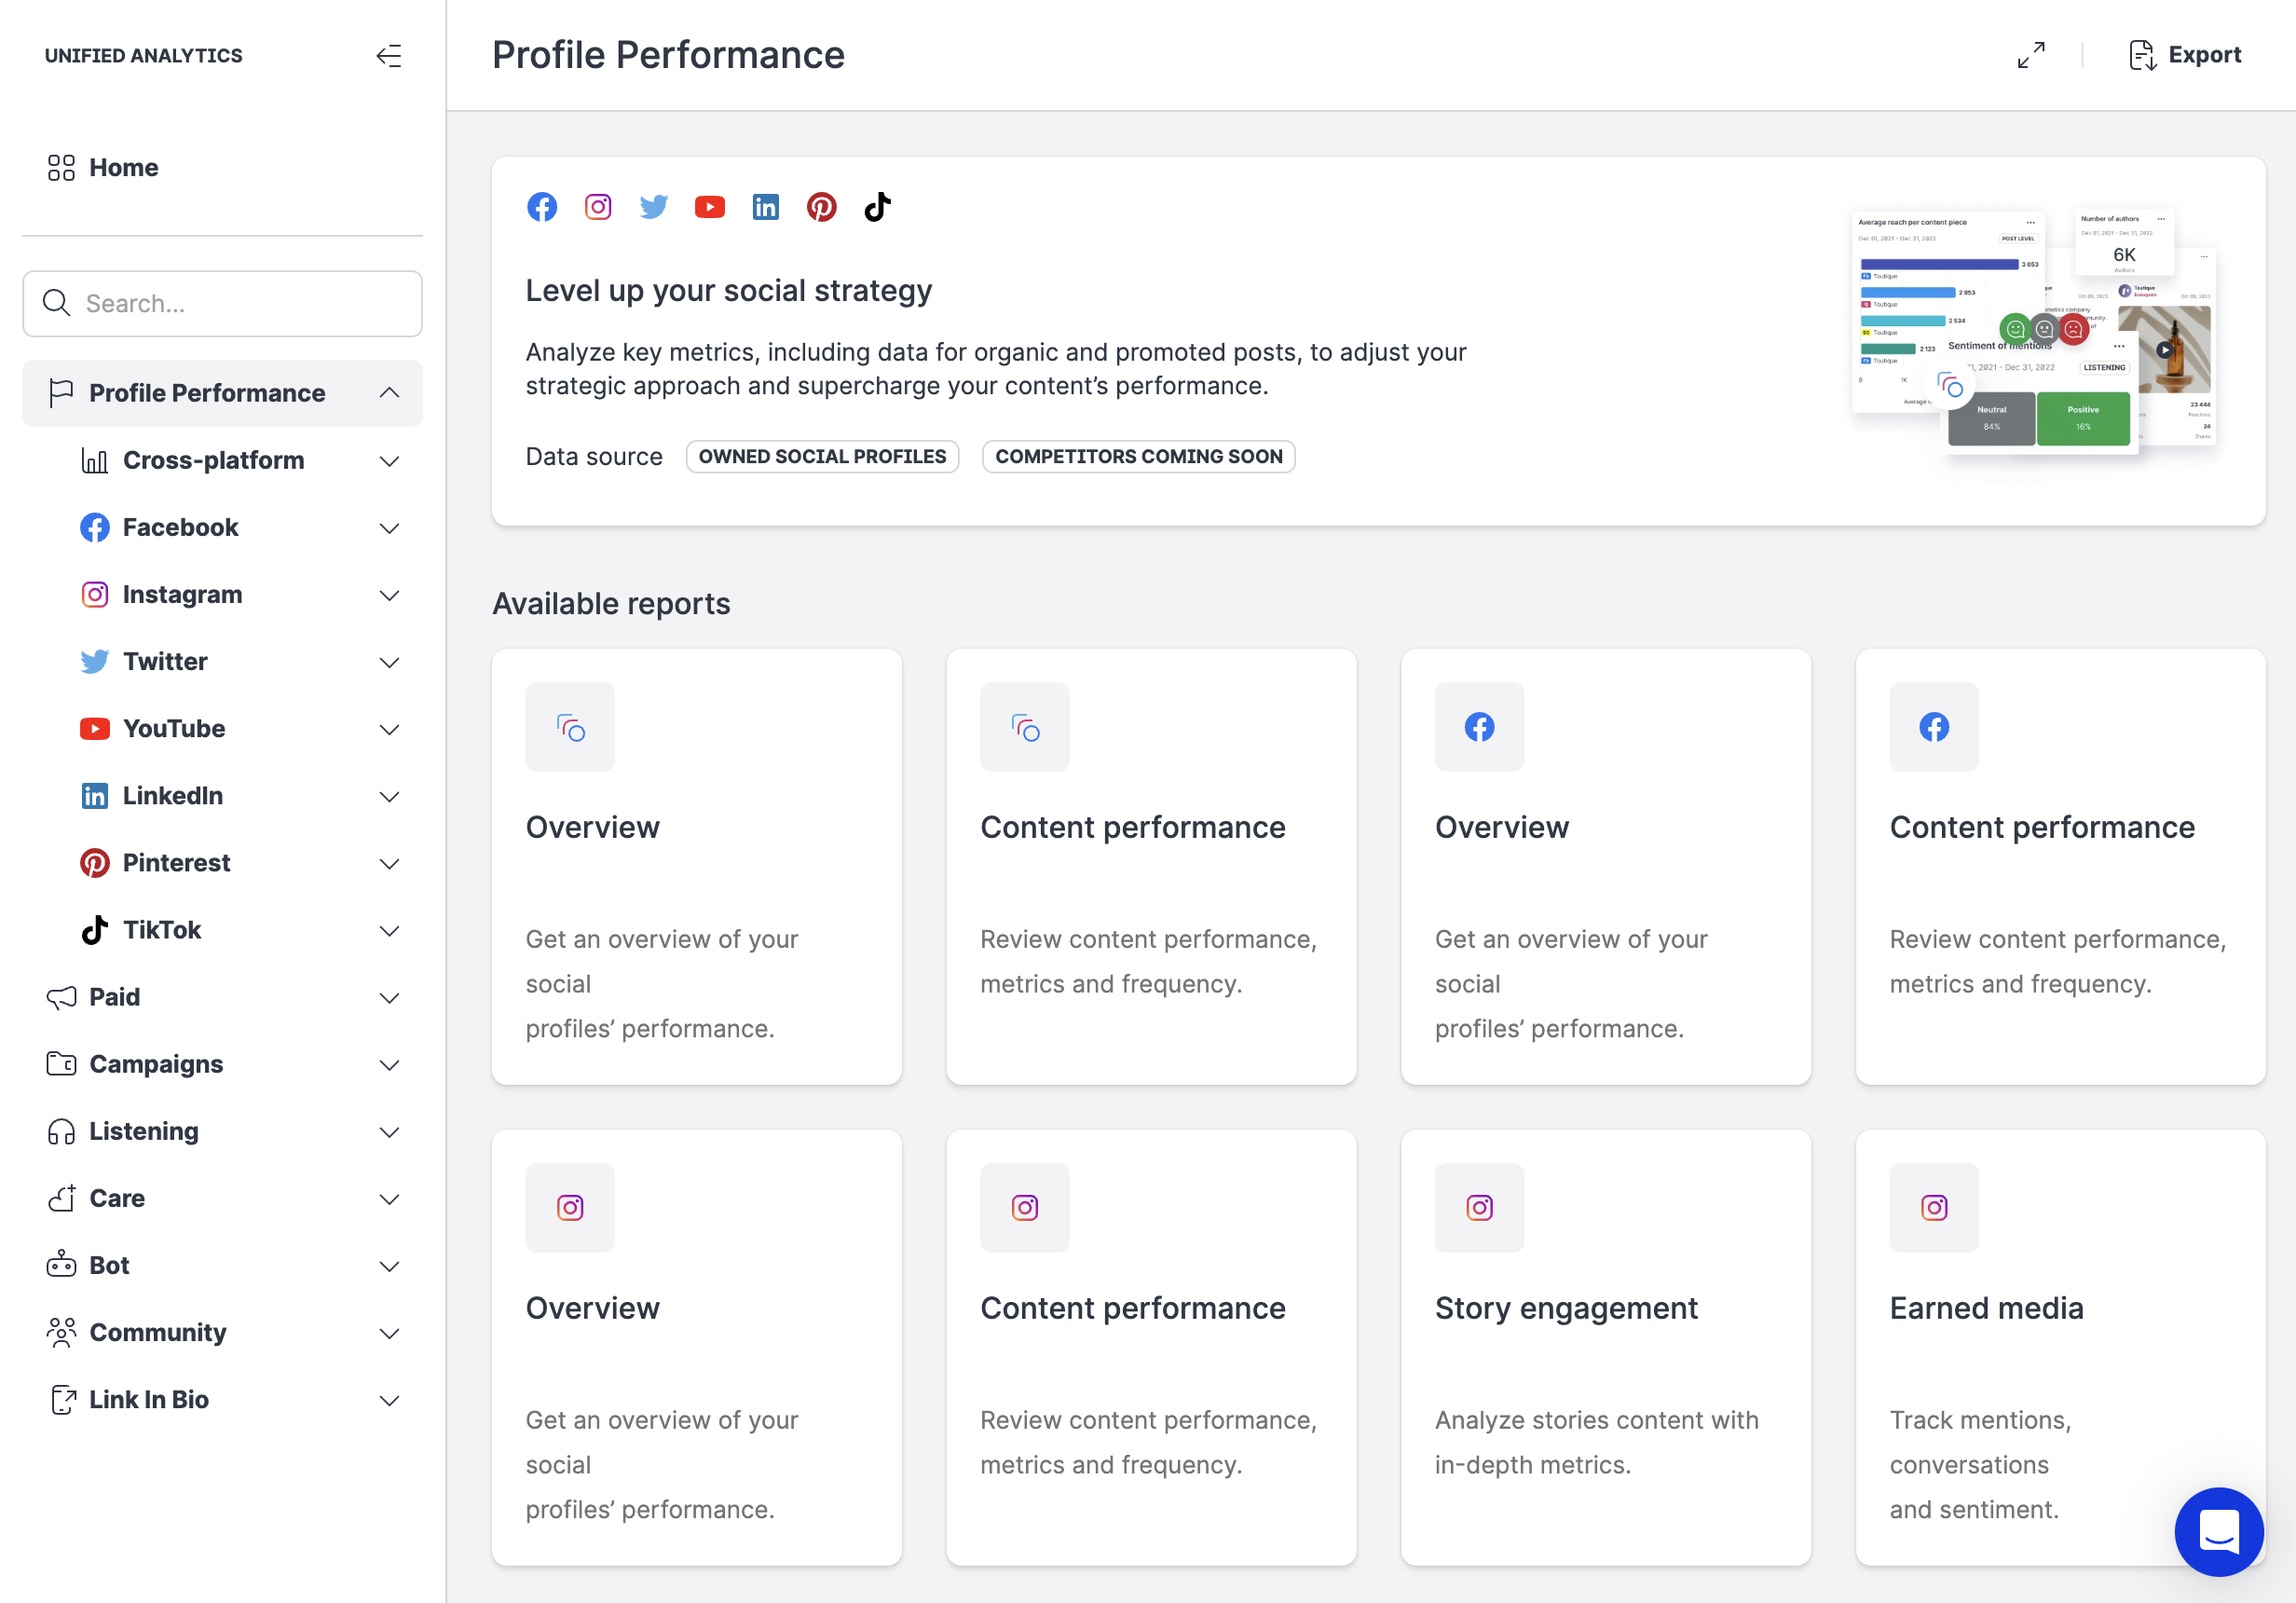
When you first open a Unified Analytics module, you find the boards pre-defined and loaded with widgets - you only need to specify the data sources.
Boards and their widgets are dynamic and re-size automatically to fit your browser window.
Select your board’s data sources
By default, boards are empty and you must choose the data source or sources that your want to analyze.
A data source can be a profile, platform, labels, bot, etc. depending on the module and/or board. You can select one or multiple items from the list. The Select all option is hidden if the list contains more than 500 items.
The bigger the data pool, the longer it takes to populate the dashboard.
In the following example, we are using the Profile performance module.
Steps:
Click Profile Performance.
Click Cross-platform.
Click Filter by profiles.
Select the profiles that you want to analyze.
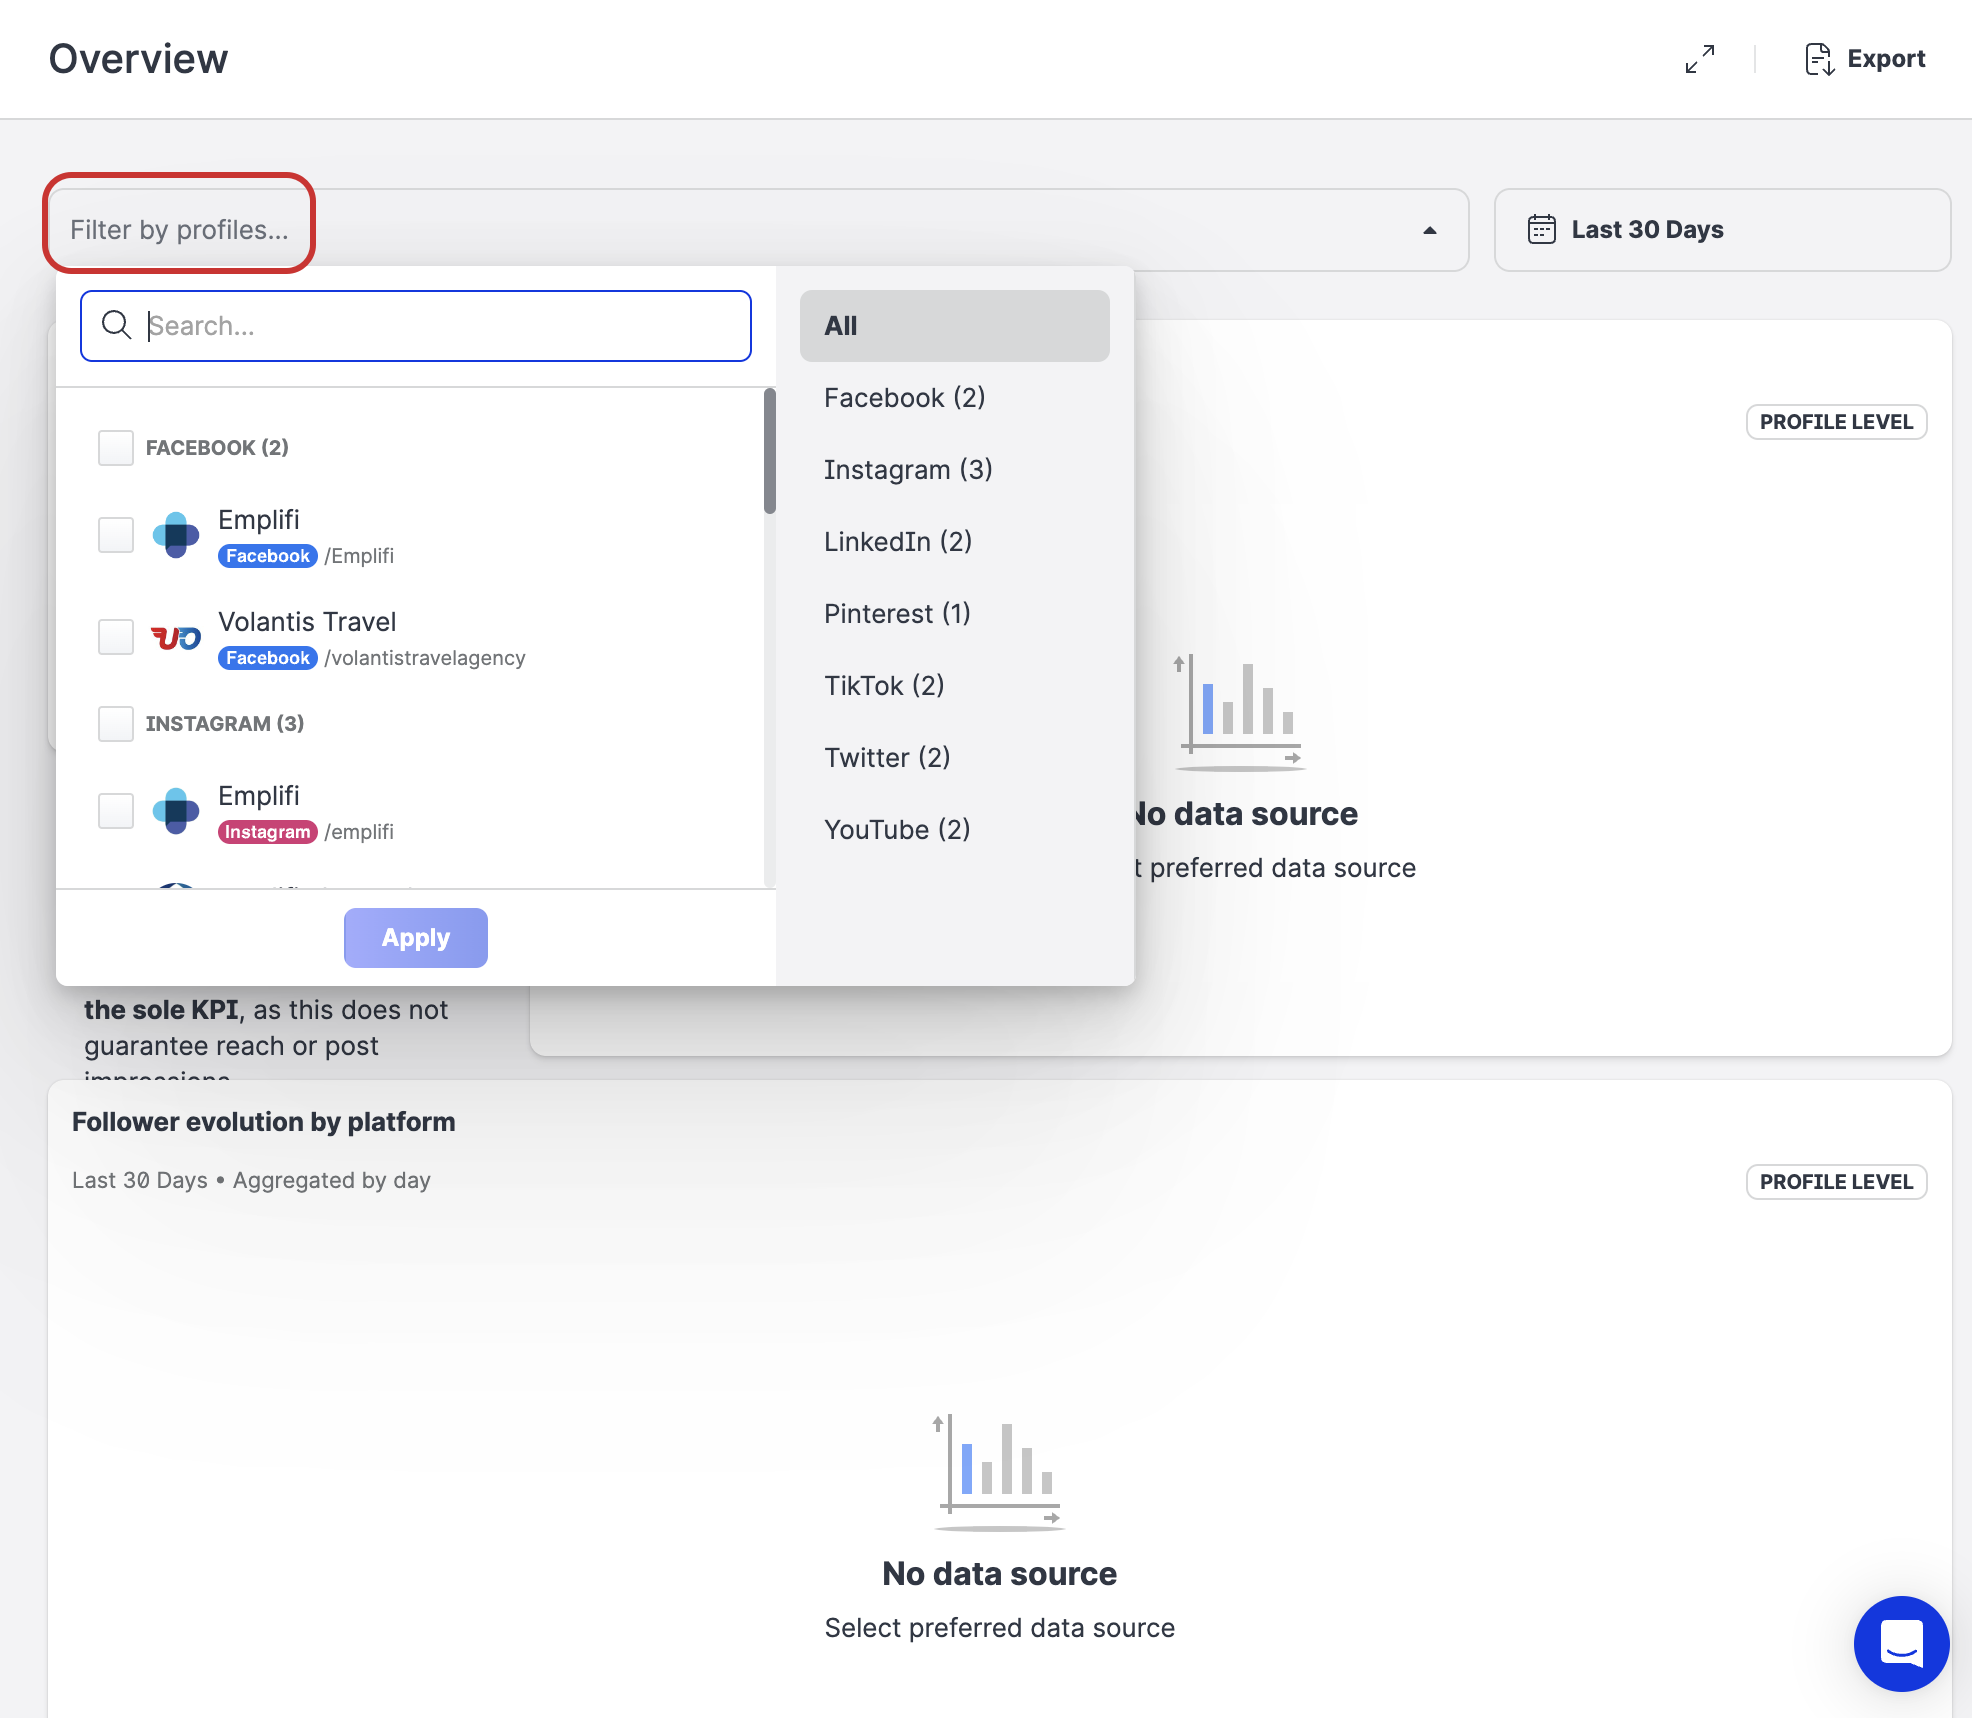
Click Apply.
Unified analytics connects to the data sources and displays visualizations of your data.
If you select multiple data sources, you will be able to see aggregated data and basic comparisons among of the sources, such as profiles, that you selected. For more information, see Compare a Profile with Another Profile.
Time period controls
By default, boards load and analyze the last 30 days of data. To change that, simply click the time period control (that says Last 30 days) and adjust the time span.
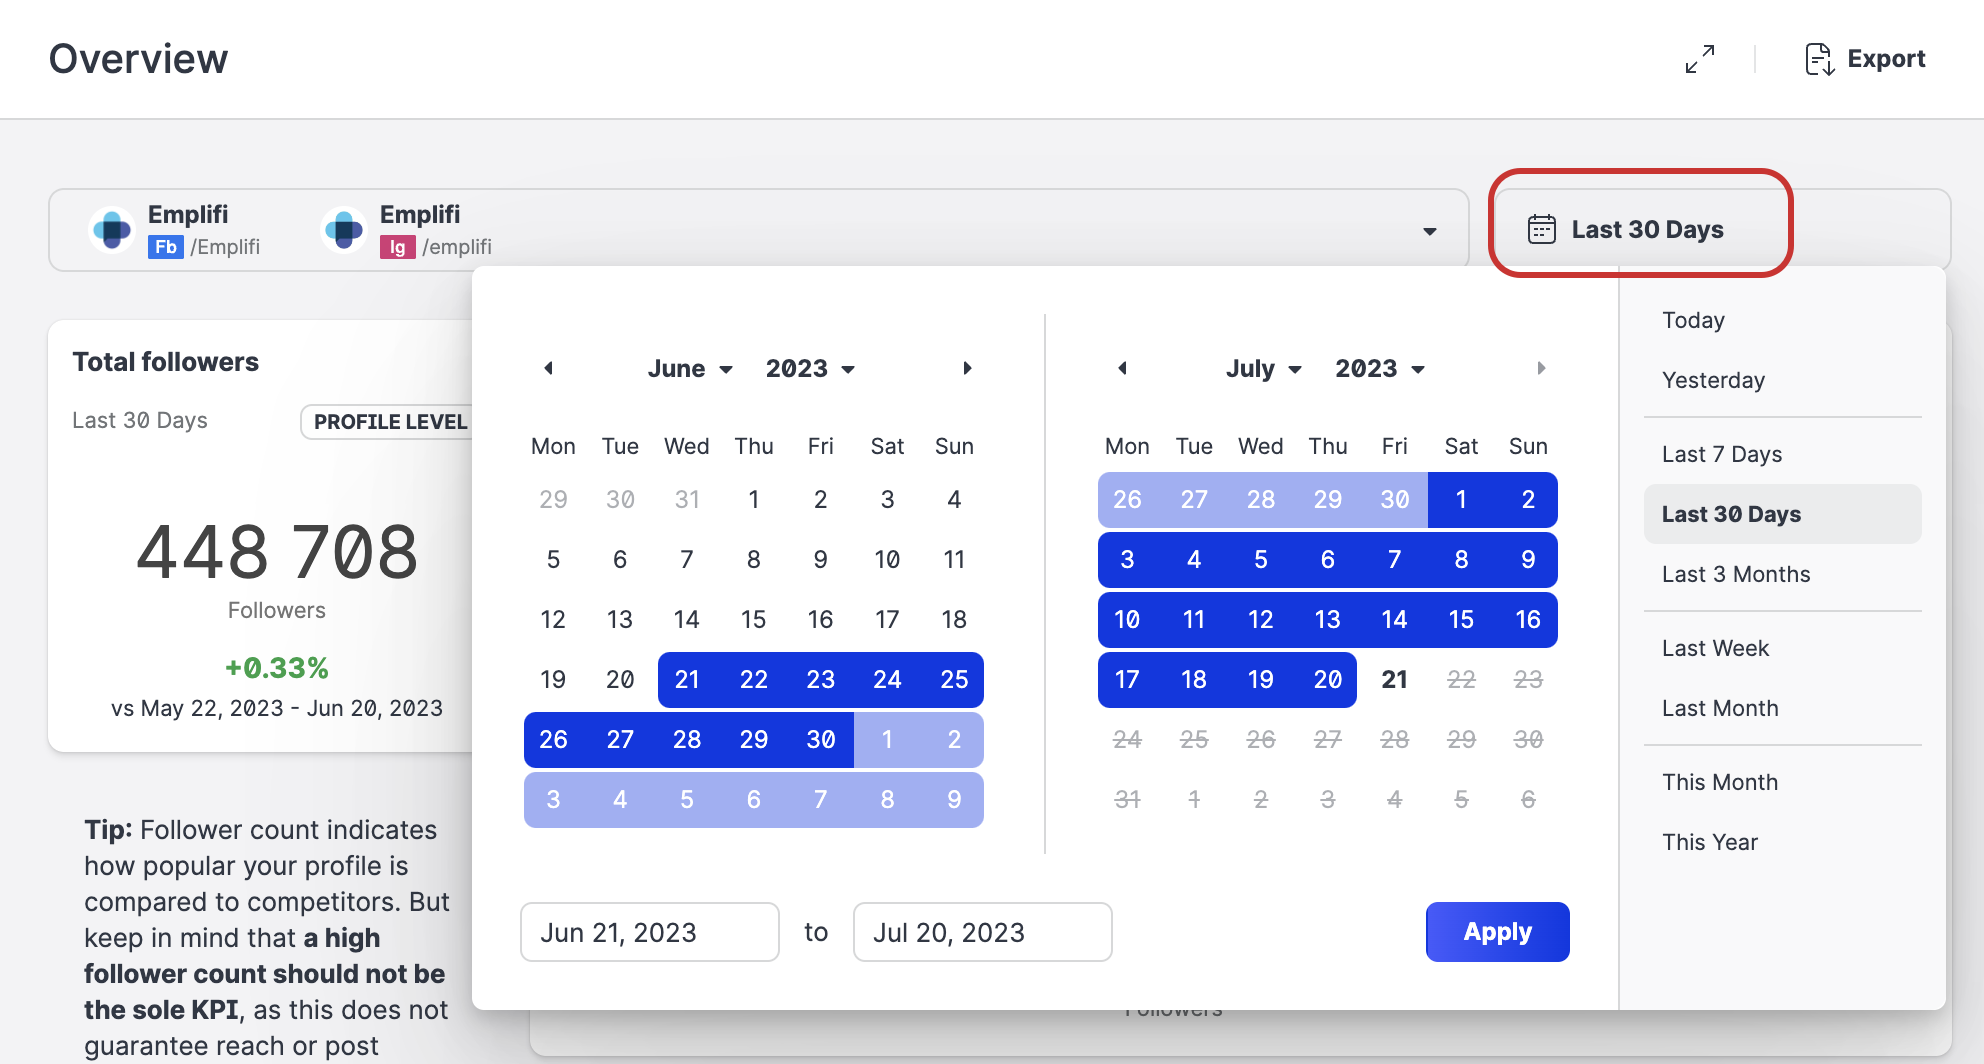
To compare two time periods head to hear, see Time Over Time Comparison in Unified Analytics.
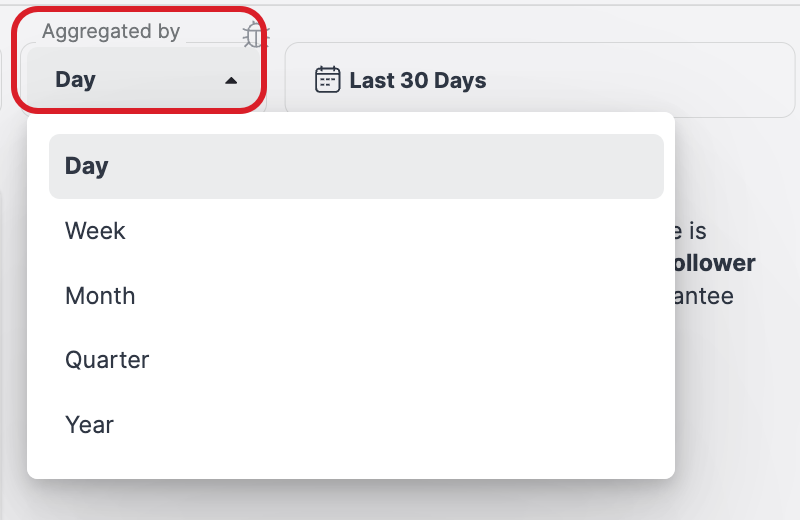
Aggregate boards across time periods
You can also display trends and evolution charts aggregated by one of the following time periods:
day
week
month
quarter
year
Time period aggregation is visible in all existing profile performance boards.
Control widget variations with toggles
Certain widgets allow you toggle between displaying visualizations of different sets of data.
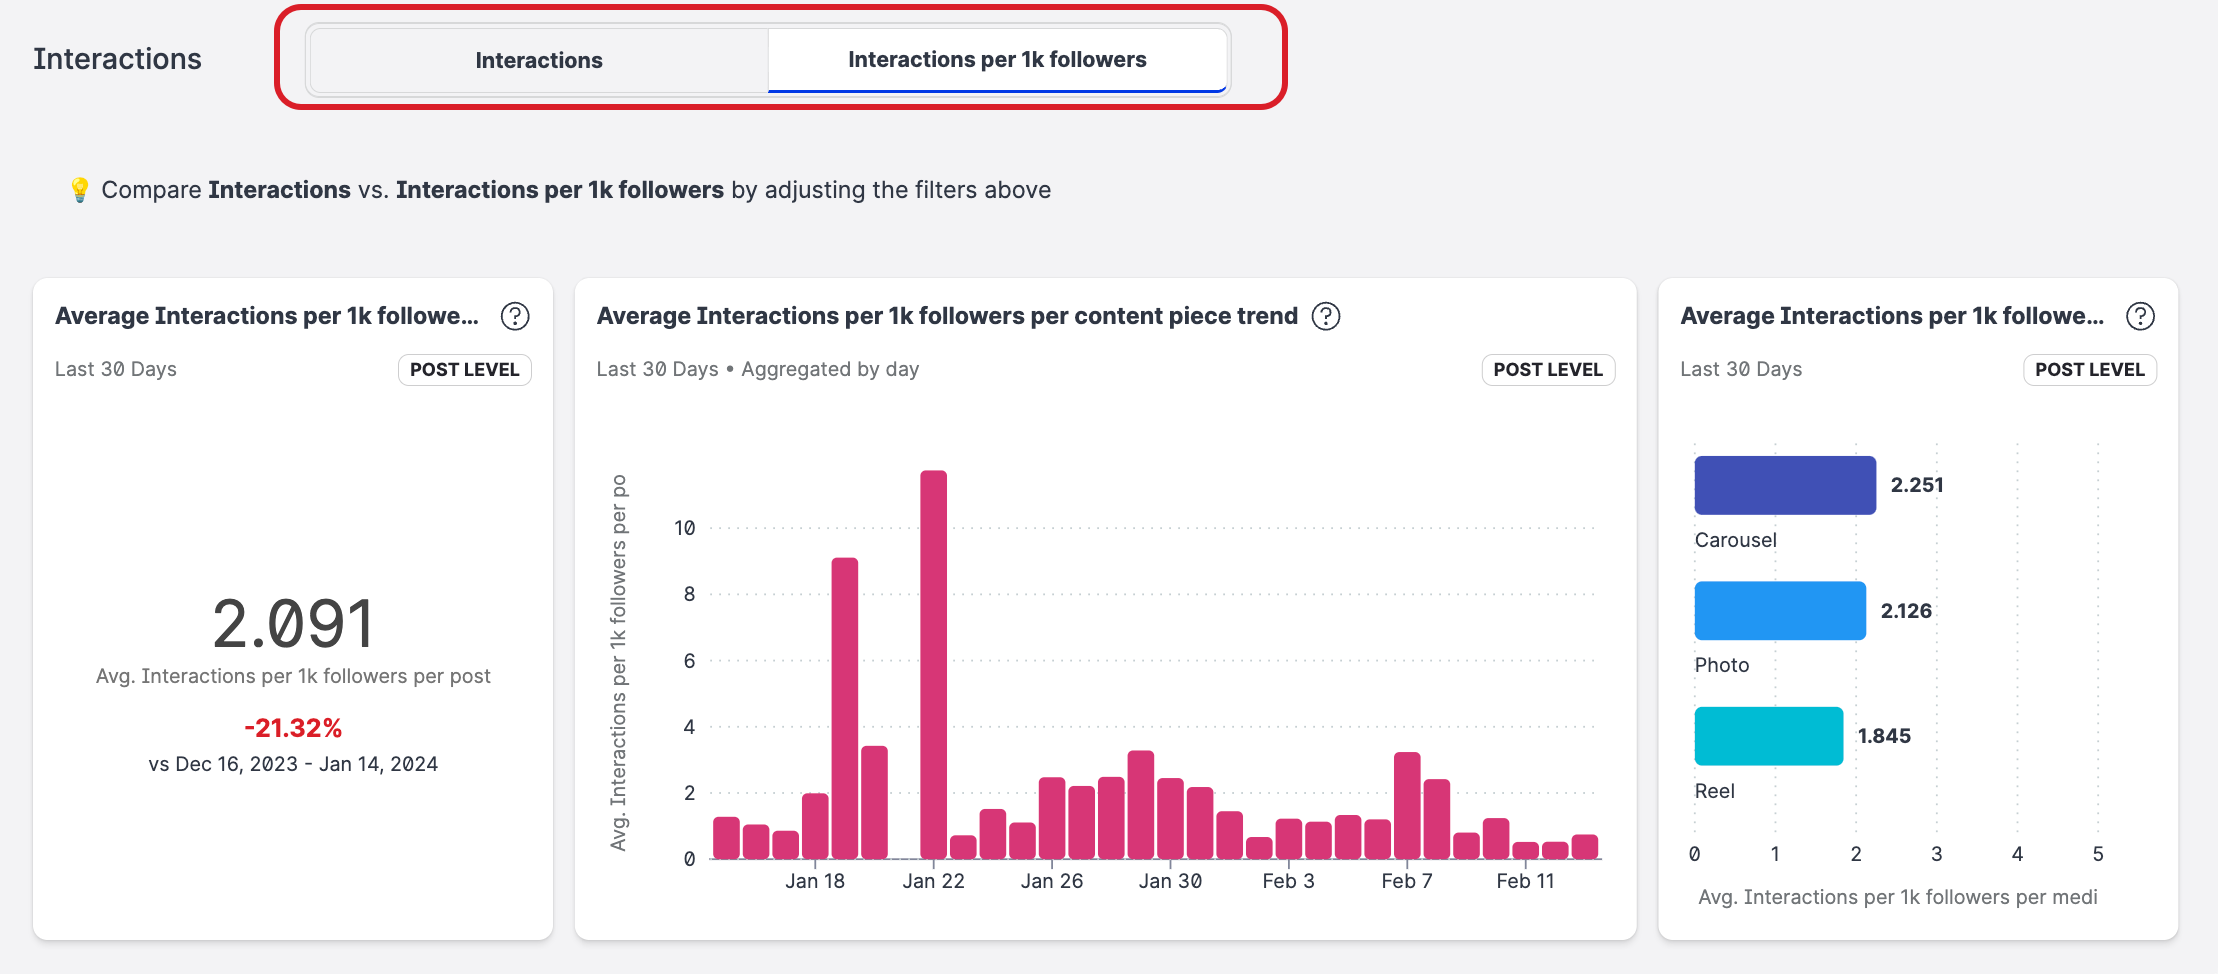
Toggles are currently supported for the following data:
Organic vs Paid data split is supported on Facebook boards.
For more information, see Paid and Organic Data in Unified AnalyticsInteractions vs Interactions per 1k followers* is supported in boards within the following modules:
Facebook
Instagram
X (formerly know as Twitter)
YouTube
LinkedIn