Performance analytics can help you better understand how widgets are performing on your website. To access these analytics, your team will need to install a tracking pixel into your site. Go to our developer documentation to learn more.
Widget Interaction
This content is also available in Emplifi Unified Analytics. To learn more, see Unified Analytics - List of Boards.
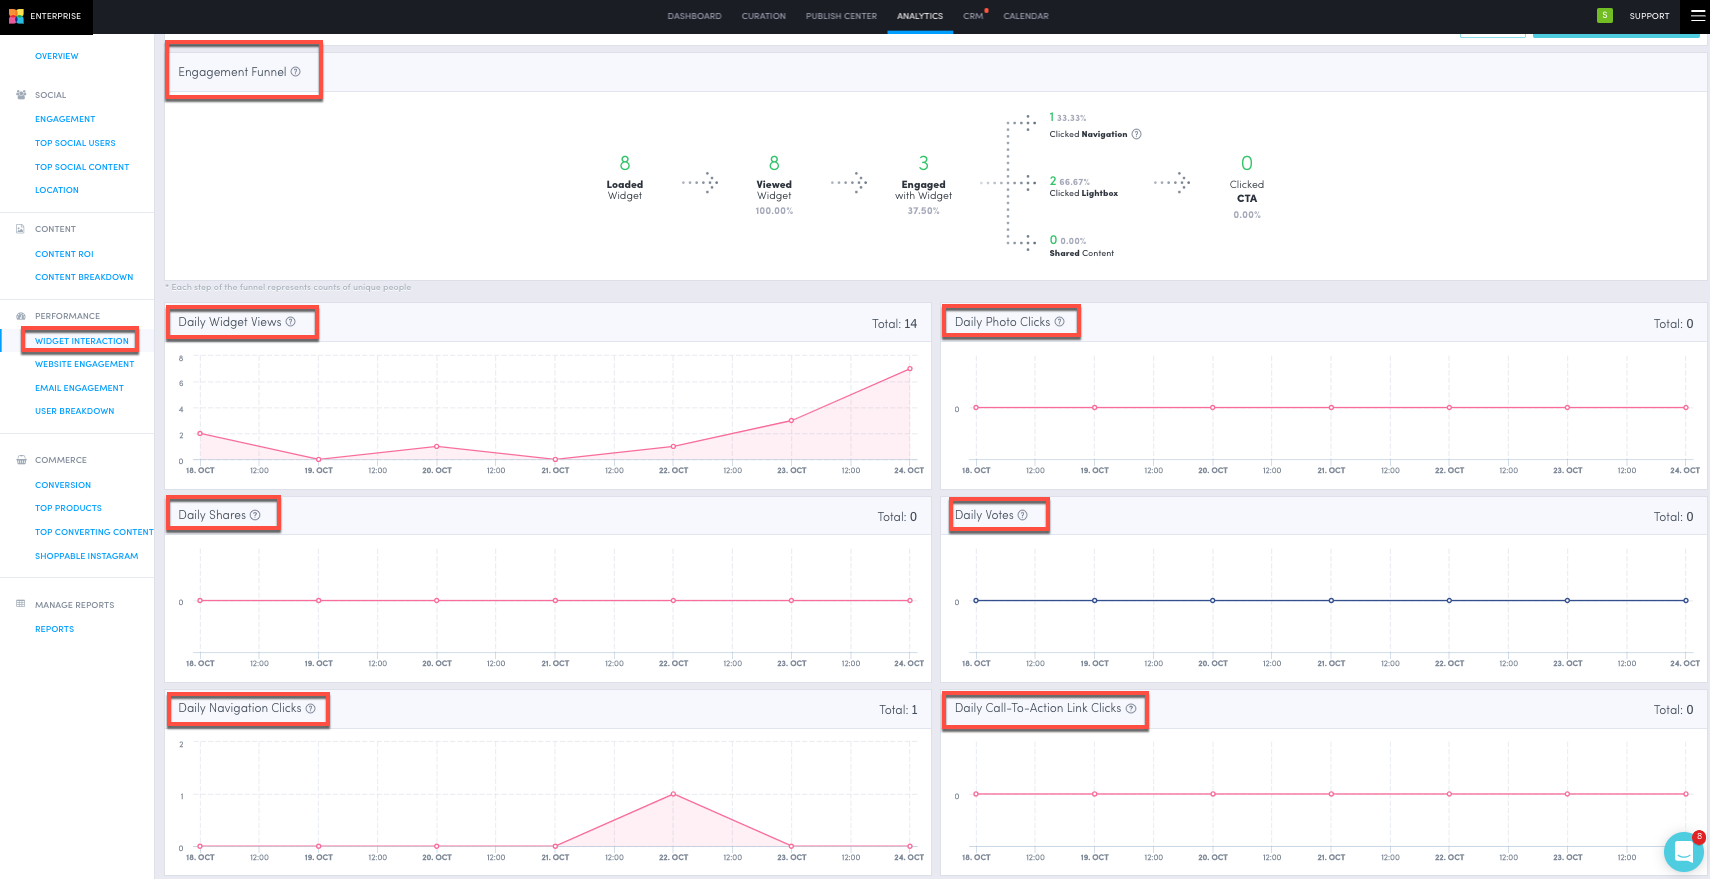
Engagement Funnel: A breakdown of how your customers are interacting with your live Emplifi UGC displays:
-
Loaded Widget: How many times a unique visitor loaded a page containing an Emplifi UGC display.
-
Viewed Widget: How many times a unique visitor viewed a Emplifi UGC display.
-
Engaged with Widget: How many times a unique visitor clicked the navigation, opened a lightbox, shared content from a display, or clicked “View More”.
-
Clicked CTA: How many times a unique visitor clicked the CTA within a lightbox.
Daily Widget Views: Breakdown over time of the total number of display views each day.
Daily Photo Clicks: Breakdown over time of the total number of photo clicks each day.
Daily Shares: Breakdown over time of the total number of shares each day.
Daily Votes: Breakdown over time of the total number of votes each day (only applicable if running a voting campaign):
-
We track votes on photos by IP address and user agents (browser data, location, etc).
Daily Navigation Clicks: Breakdown over time of the total number of navigation clicks (including arrows and the “View More” button) each day.
Daily Call-To-Action Link Clicks: Breakdown over time of the total number of CTA clicks each day.
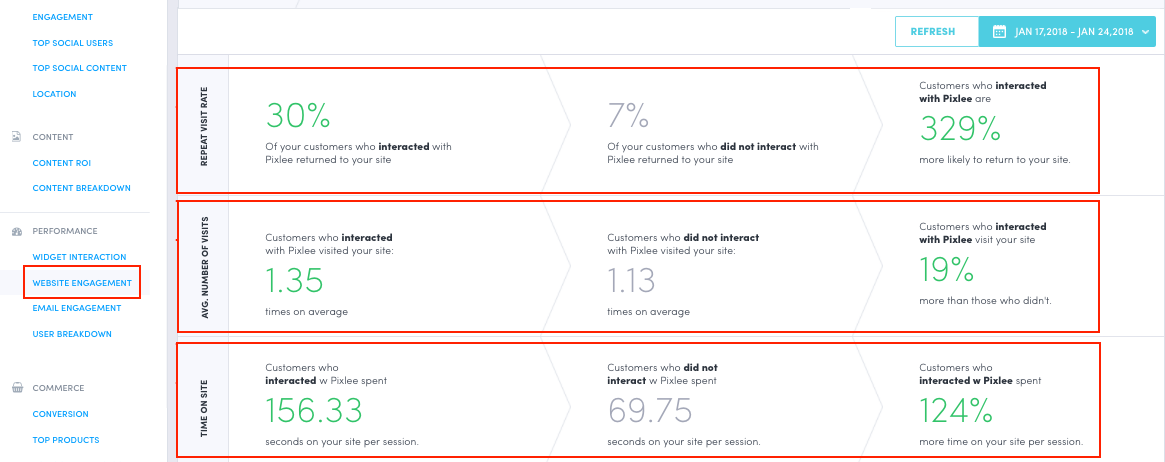
Website Engagement
Repeat Visit Rate: Compare how often unique visitors return to your site when they engage with Emplifi UGC versus when they do not engage with a Emplifi UGC display.
Average Number of Visits: Compare the average number of visits unique visitors make to your site when they engage with Emplifi UGC versus when they do not engage with a Emplifi UGC display.
Time on Site: Compare the average time on site for unique visitors when they interact with Emplifi UGC versus when they do not interact with a Emplifi UGC display.
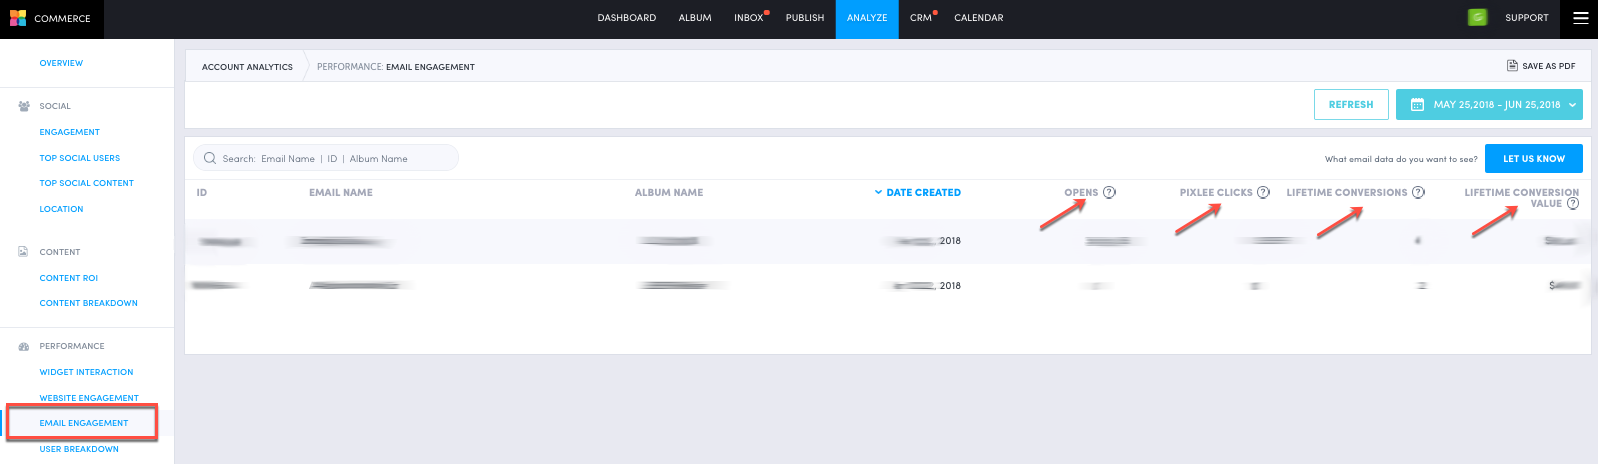
Email Engagement
Email Engagement: View a list of email displays that have been created within the set time range:
-
Opens: Total number of times the email has been opened.
-
Pixlee Clicks: Total number of clicks on the Emplifi UGC content.
-
Lifetime Conversions: Total number of conversions from the Emplifi UGC email content.
-
Lifetime Conversion Value: Total amount of conversion value in $.
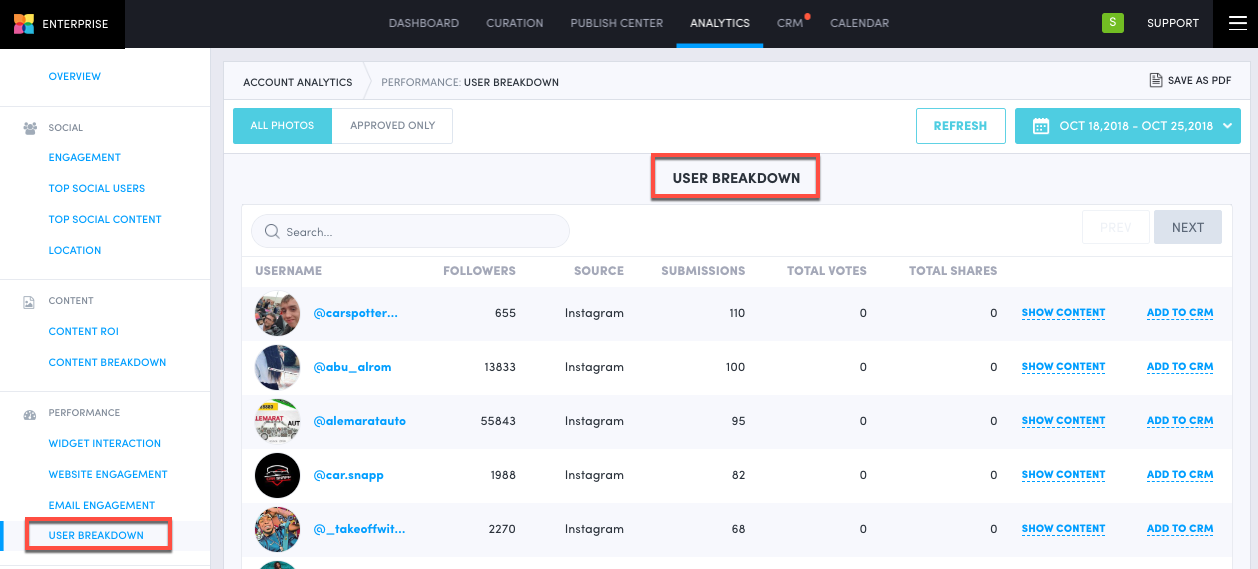
User Breakdown
User Breakdown: View the full list of user handles who have submitted content or search for a specific user handle. Click “Show Content” to view content submitted or click “Add to CRM” to add them to your social CRM.