There are six types of custom analytics reports that are available:
Top Converting Content: This report provides a detailed breakdown of your best-performing content by username, click opens, add to carts, conversions, and total conversion value.
Top Products: This report provides a detailed breakdown of your top products by product name, Emplifi UGC add-to-carts, add-to-cart value, Emplifi UGC conversions, and total Emplifi UGC conversion value. You can also see a breakdown of content for each product.
Shoppable Instagram: This report provides a detailed breakdown of your Shoppable Instagram’s performance in terms of click-backs, conversions, likes, and comments for each piece of content.
Widgets: This report provides insight into the performance of each live widget you have deployed on your website. You will see a breakdown of gallery opens, interactions, clicks, engagement rate, add to carts, conversions, and conversion rate for each individual widget.
Email: This report will break down the total clicks, conversions, and total conversion value for an Emplifi UGC widget in the selected email.
Social: This report provides insight into social-related analytics that reflects either your Instagram or X (formerly Twitter) accounts.
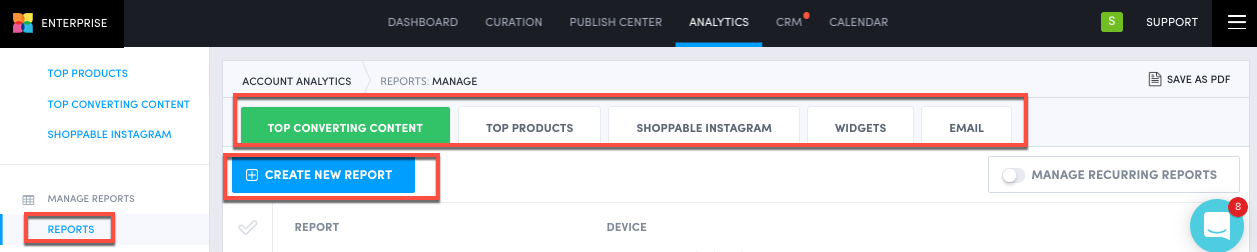
After creating a new report, it will be emailed to you when ready to view. Depending on the date range of your report, it may take up to a few hours to create.
You can also view a finished report by returning to your reports where you will be able to select, view, and download a report that you have created.
Do you have feedback or more questions? You can contact us through our Emplifi Customer Center.