Commerce analytics helps you understand how your widgets affect conversion and which products and photos perform the best.
Conversion
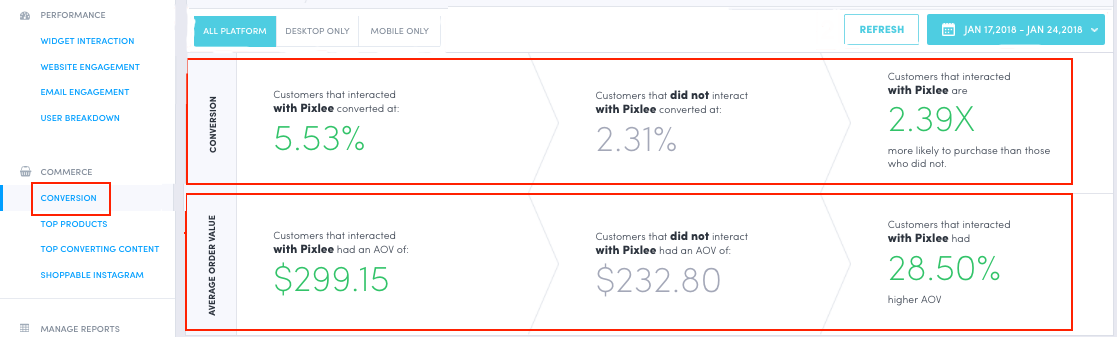
Conversion: Compare the average conversion rate for unique visitors when they interact with an Emplifi UGC display versus when they do not interact with an Emplifi UGC display.
Average Order Value: Compare the average order value when customers interact with an Emplifi UGC widget versus when they do not interact with an Emplifi UGC widget.
Conversion Funnel: A breakdown of the total unique page loads, display interactions, add-to-carts, and conversions for unique visitors that interacted with an Emplifi UGC display.
Total Products Sold: The total products sold to unique visitors who interacted with an Emplifi UGC display.
Total Revenue: The total conversion revenue that was impacted by Emplifi UGC display interactions.
Top Products: The top products with the most conversions when visitors interact with Emplifi UGC displays.
Top Converting Photos: The photos that drive the most conversions from views, opens, and shares.
Shoppable Instagram
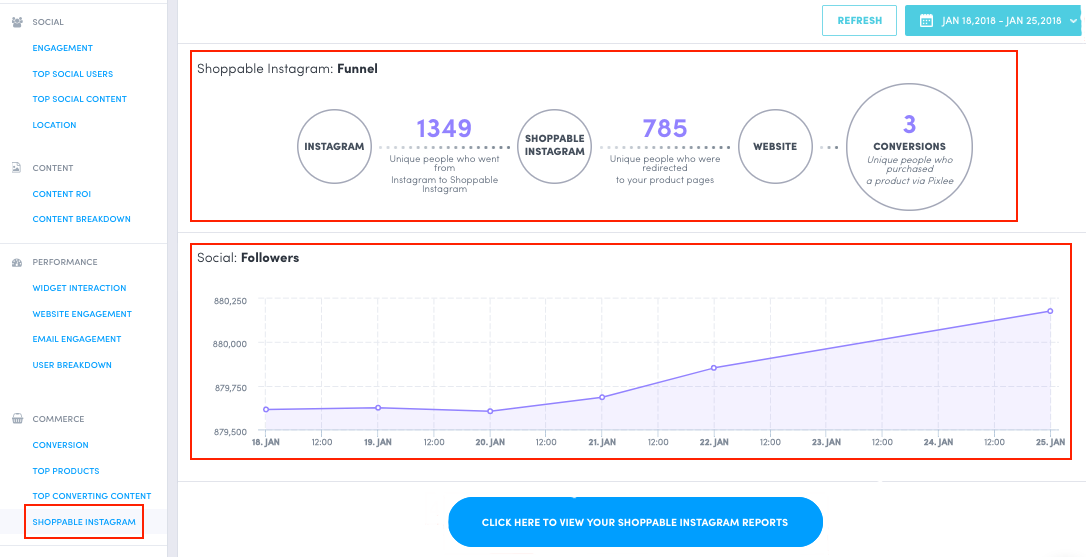
Funnel: A breakdown of how many unique visitors landed on your Shoppable Instagram, clicked on a product to get redirected to a product page, and ultimately converted.
Followers: Track how your Instagram follower count changes over time.