Build a Custom Widget in Unified Analytics
This section describes features that are only available within the Emplifi’s early access program.
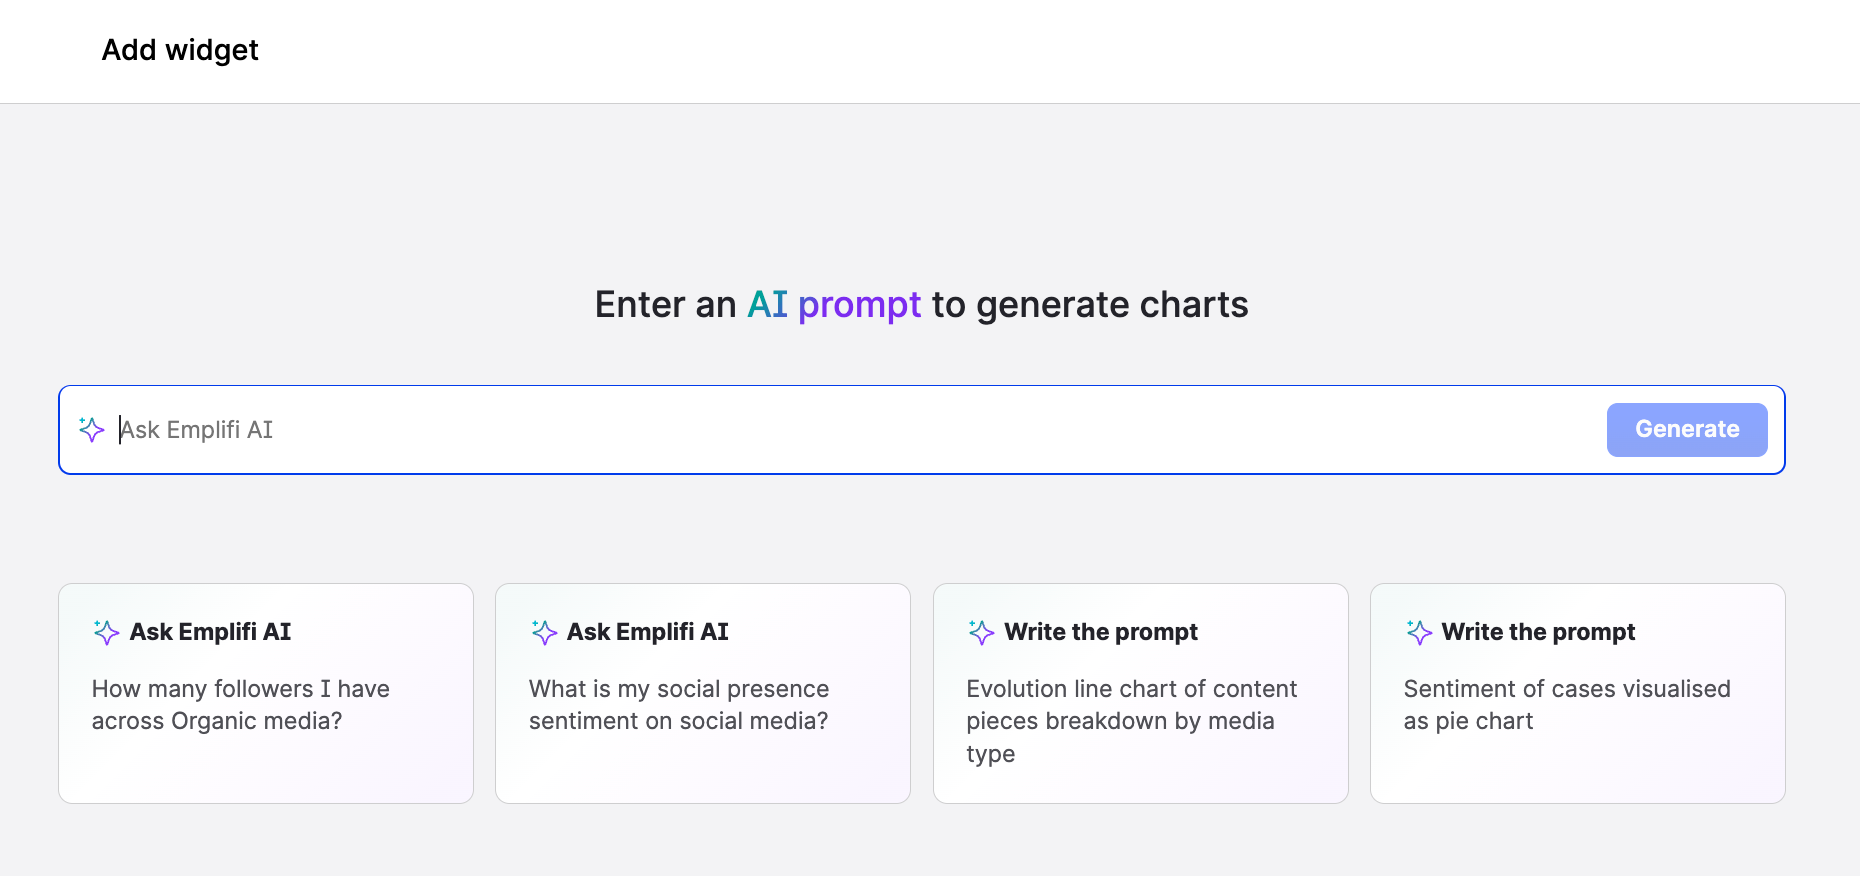
You can quickly create a brand new chart (widget) by simply typing a prompt or asking the question.
Once Unified Analytics renders your chart, you can use it for your ad hoc analysis, export it for use in other tools, or add it to a board.
On the Unified Analytics home page, click the Generate a chart tile and write your prompt.
Steps:
Click one of the following options:
Ask Emplifi AI
AI responds to your question by generating widgets.Write the prompt
AI uses your entry to generate the prompt and, subsequently, the widgets.
Review the widgets that were generated. If the widgets do not match your needs, review your question/prompt and regenerate the widgets options.
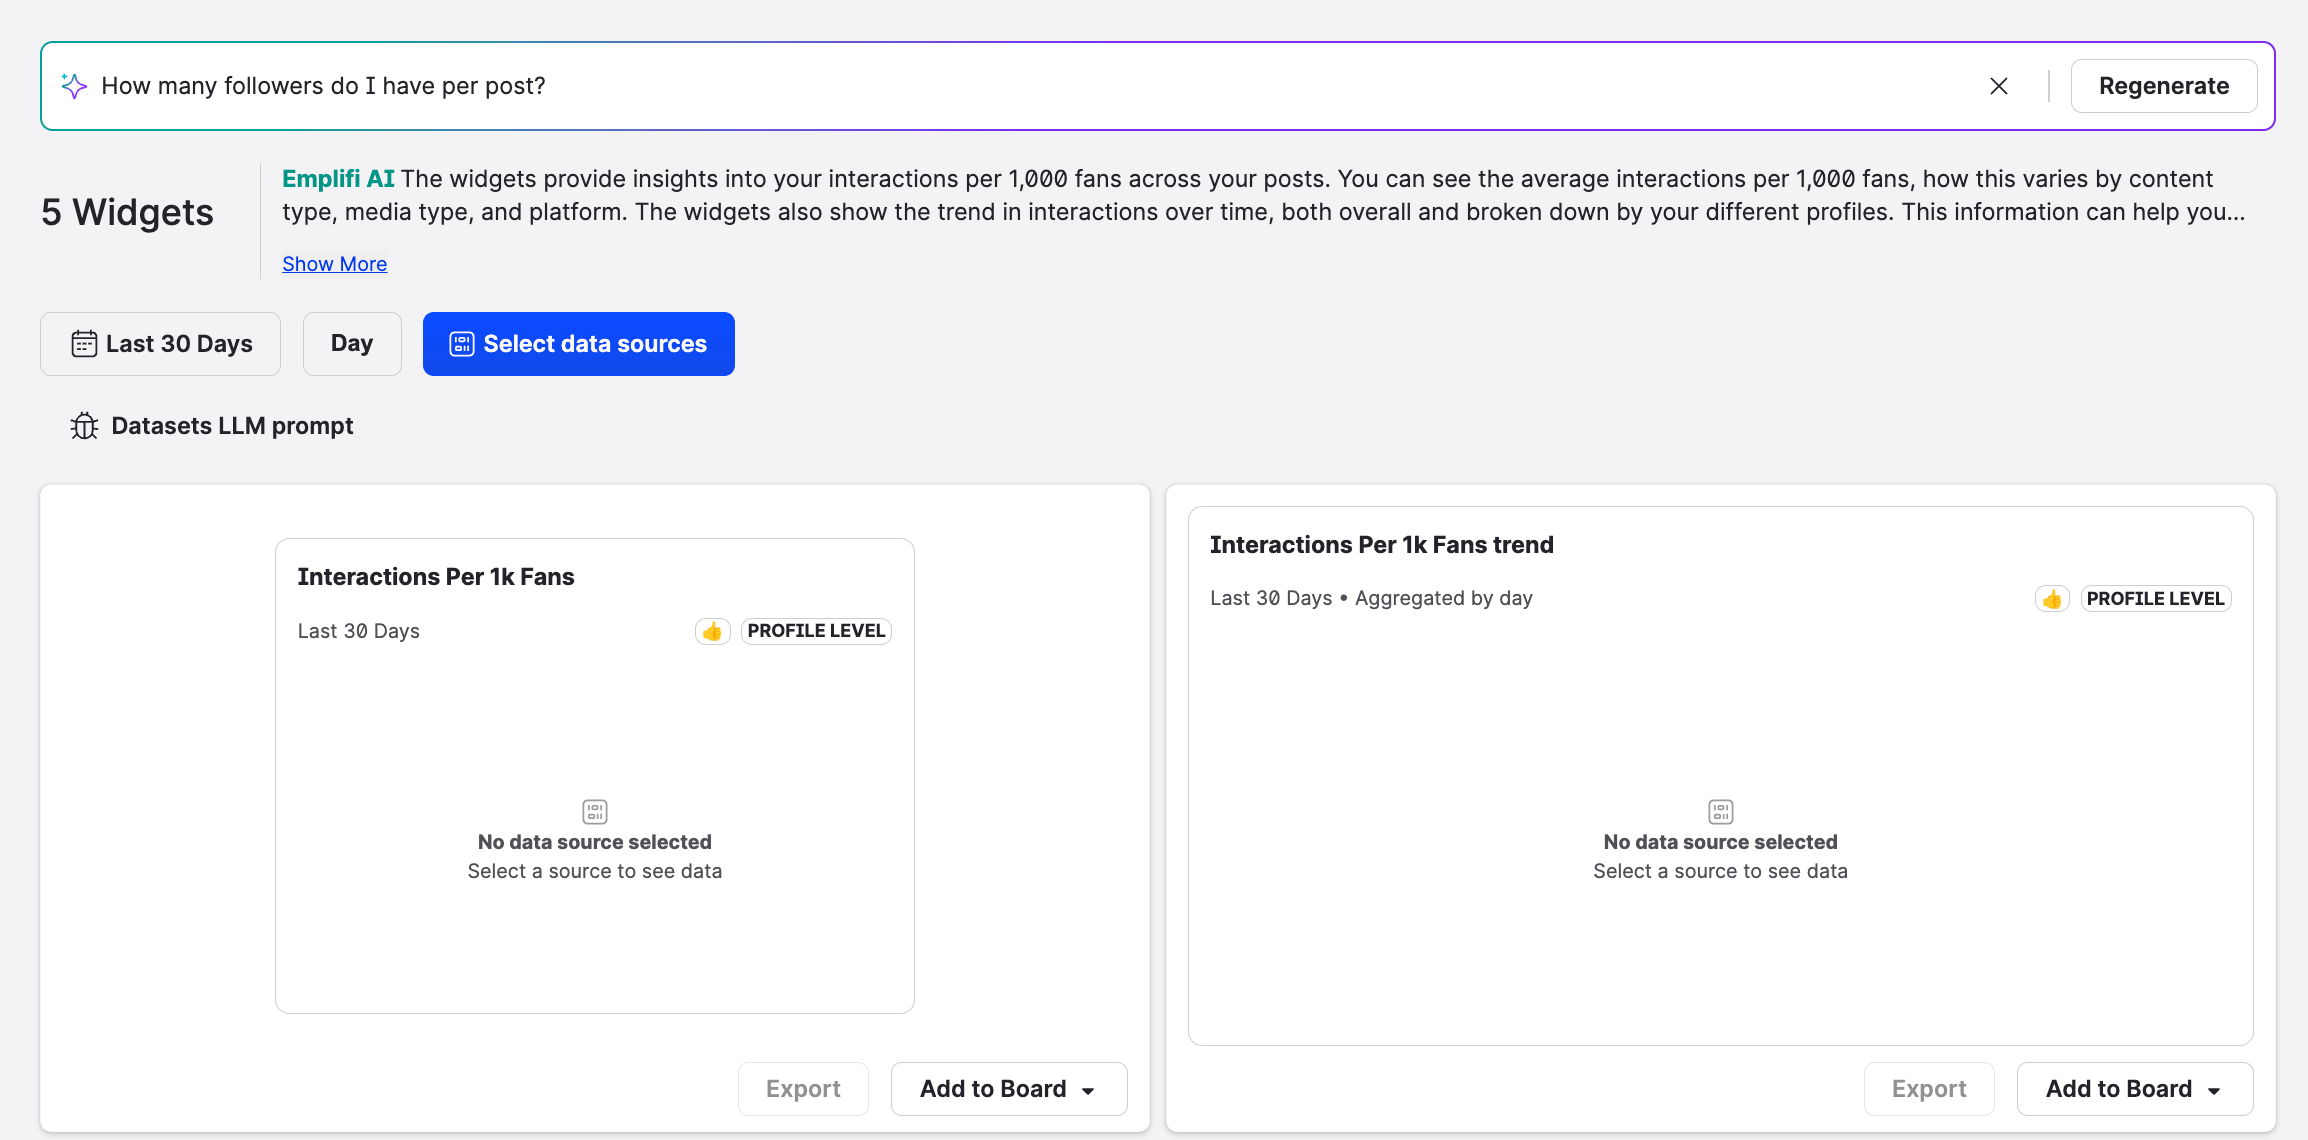
Select the data source and wait for the visualizations to appear.
Profile labels
Profiles
Review the widgets and apply the filters.
Using new widgets
You can use new widgets for a quick analysis and
After you generate new widgets, you export them as any other stock Unified Analytics widget.
png
xlsx
csv
You can also add a new widget to an existing board - your own or a board that was shared with you.
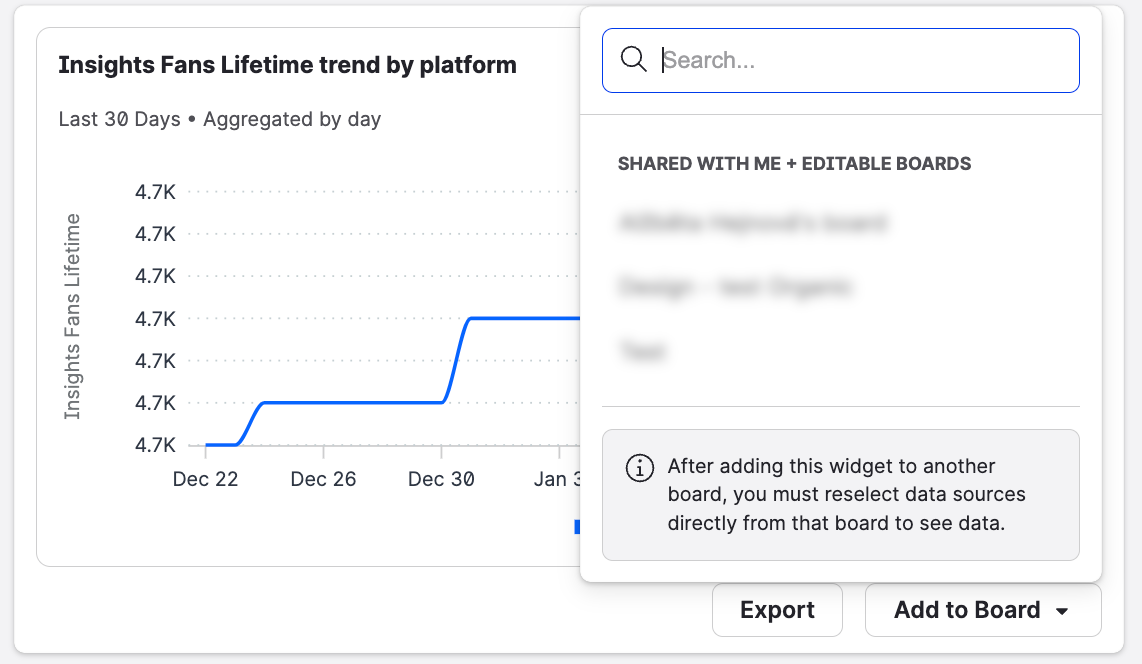
The board that you select overwrites the widget’s filters and data sources. If the target board serves a different purpose, we advise that you create a new board that better reflects the specific business case.