The Agents Analytics page provides data about Agent performance in escalated conversations. You can use this information to evaluate your agents' productivity and workload, and to determine if any adjustments need to be made. You can also adjust the time frame of the charts to get a more comprehensive view of the incoming data.
This page is unavailable on the Social Chatbot interface.
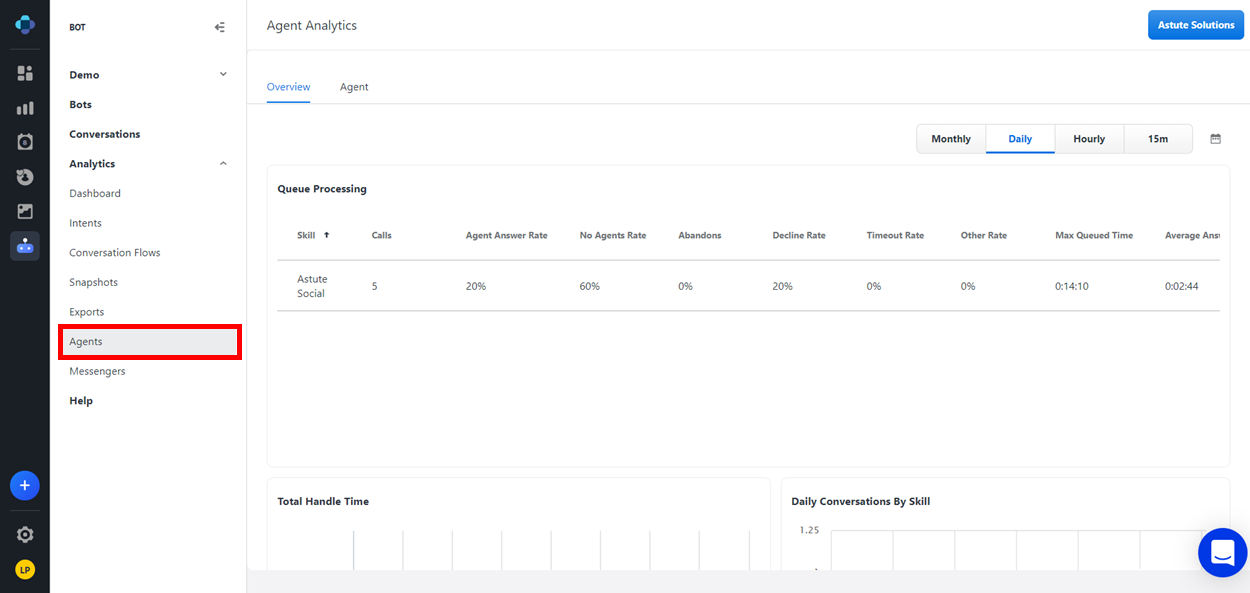
Accessing the Agents analytics page
-
From the Application Bar, click the Analytics.
-
Click Agents.
Agents analytics page layout
When you open the Agent Analytics page, there are two tabs available: Overview and Agent.
Overview tab
On this tab, you can view overall agent performance.
Global settings
To view data, you must first select an Agent Group. To do so:
-
Click Please Select an Agent Group in the top right corner of the Agent Analytics page.
-
Select an Agent Group from the drop-down menu.
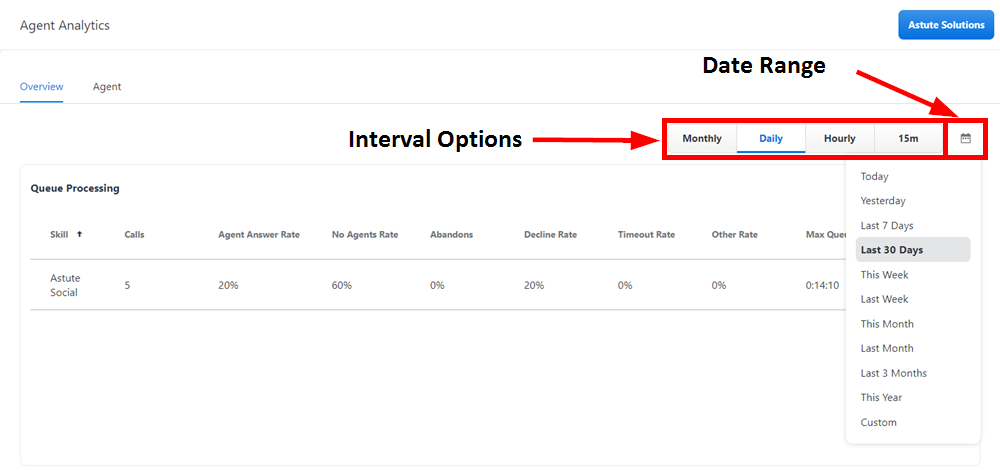
You can filter the data by using the drop-down menu to select different time frames for the charts.
Queue processing
This table displays some statistics for historical chats, separated by agent skill. These statistics are:
-
The number of chats that were answered.
-
The percentage of answered chats vs. non-answered chats.
-
The percentage of abandoned chats.
-
The percentage of declined chats.
-
The percentage of timed-out chats.
-
The maximum time that chats were in queue.
-
The average time it took to answer a chat.
This page also displays:
-
Total Handle Time by Skill, in the form of a bar chart.
-
Daily Conversation by Skill, in the form of a line chart.
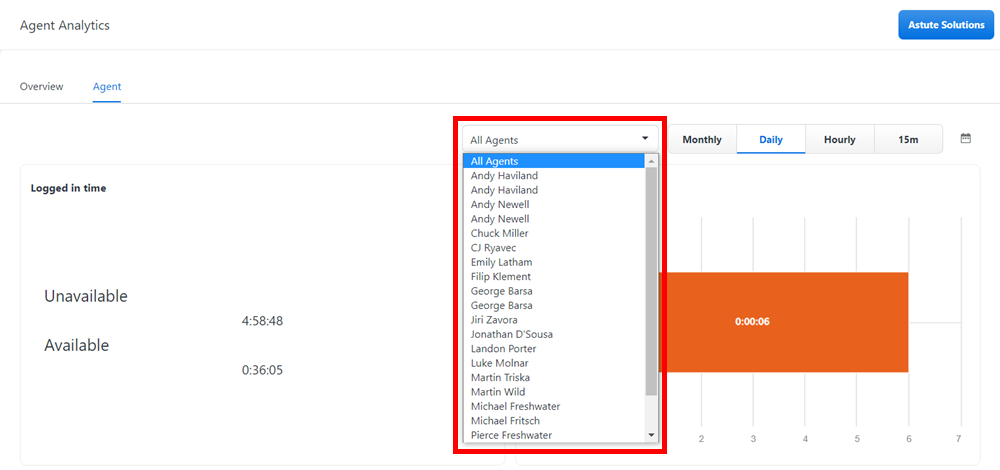
Agent tab
On this tab, you can view date-specific data for selected agents.
After clicking on this tab, you have one additional filter option: choosing all agents in the group, or one specific agent.
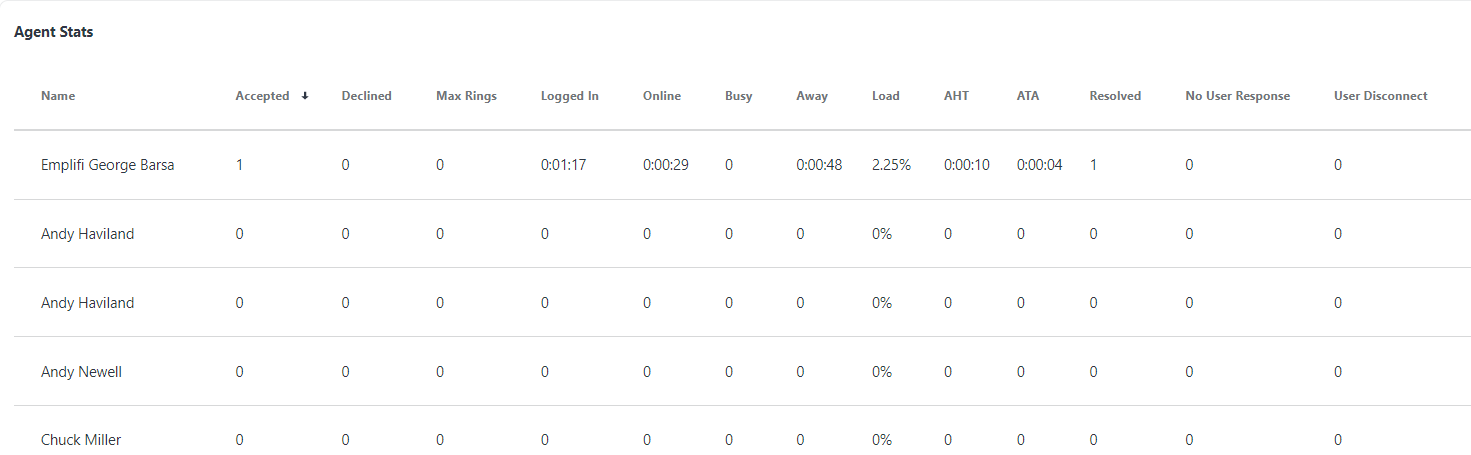
Agent stats
This table shows you a list of important statistics for the selected agent group.
-
Name: Displays the name of the agent.
-
Accepted: Displays the number of user chats accepted by the agent.
-
Declined: Displays the number of user chats declined by the agent.
-
Max Rings: Displays the number of incoming chats that reached the maximum number of rings for this agent.
-
Logged In: Displays the amount of time this agent has spent logged in to Emplifi Bot.
-
Online: Displays the amount of time this agent has spent with a status of "Online".
-
Busy: Displays the amount of time this agent has spent with a status of "Busy".
-
Away: Displays the amount of time this agent has spent with a status of "Away".
-
Load: Displays the conversational load of this agent, calculated as the total time they have spent in conversation divided by the total amount of time they have been available.
-
AHT (Average Handle Time): Displays the average amount of time that this agent spent in user chats.
-
ATA (Average Time to Answer): Displays the average amount of time that it took an agent to answer user chats.
-
Resolved: Displays the number of closed user chats this agent has marked as "Resolved".
-
No User Response: Displays the number of closed user chats this agent has marked as "No User Response".
-
User Disconnect: Displays the number of closed user chats this agent has marked as "User Disconnect".
Daily engagements
This chart shows you what happened in the conversation (i.e. how many were opened, closed, transferred, or declined).
Daily load
This chart show you a percentage of total conversational load on agents, calculated by taking the total amount of time they spent in conversations throughout the time period by the total amount of time they were available.