Video Analysis in Emplifi
Video is an integral part of an engaging social media marketing strategy. Because creating videos can often be more labor and resource intensive, it's so important to have quick and accurate access to data insights on video performance to improve over time. In Emplifi, drive a smart and effective video strategy. Across the platform, it's easy to zoom in on video performance from a granular metrics' perspective or take a macro approach, seeing how the video format really fits into your wider social media success.
In this article, learn how and where you can support video strategy using the Emplifi platform.
Video Analysis in Dashboard
Dashboards provide an easily digestible, easily sharable bird's eye view of content performance from a variety of perspectives. Once you set up a dashboard with your preferred widgets, visualizations, and time range, you're good to go. Make your dashboard truly useful by customizing your widgets' data sources, filtering, and breakdowns, slicing and dicing data without hassle.
For video performance analysis, the following is available for you in Dashboards:
Video views (Facebook, Instagram, Twitter, YouTube)
Media Views (Facebook, Instagram, Twitter, YouTube)
Average % Video Watched (Facebook)
Video Views (Facebook)
Organic Video Views (Facebook)
Paid Video Views (Facebook)
30-second Video Views (Facebook)
Click to Play Video Rate (Facebook)
Video Benchmark Score (Facebook)
Number of New Videos (YouTube)
Video Views (YouTube)
Content (YouTube)
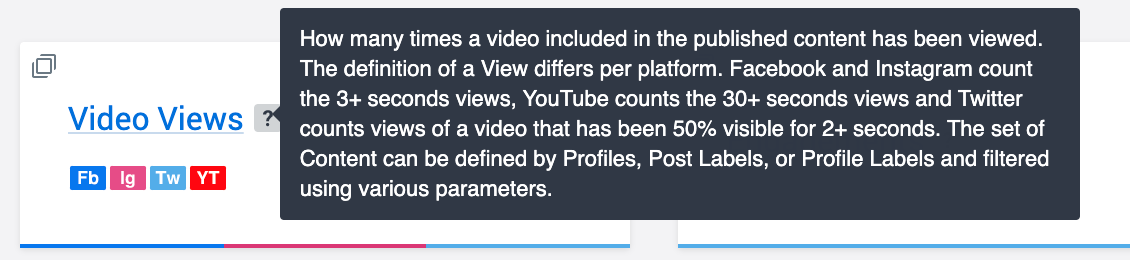
To learn more about what the widget will measure, hover over the question mark to see the tooltip. Here is the tooltip for the flexible widget Video Videos.
Video Analysis in Analytics
Charts in analytics help you understand the success of social media content from various perspectives, including engagement, promotion efficiency, content types, user activity, labels, and more.
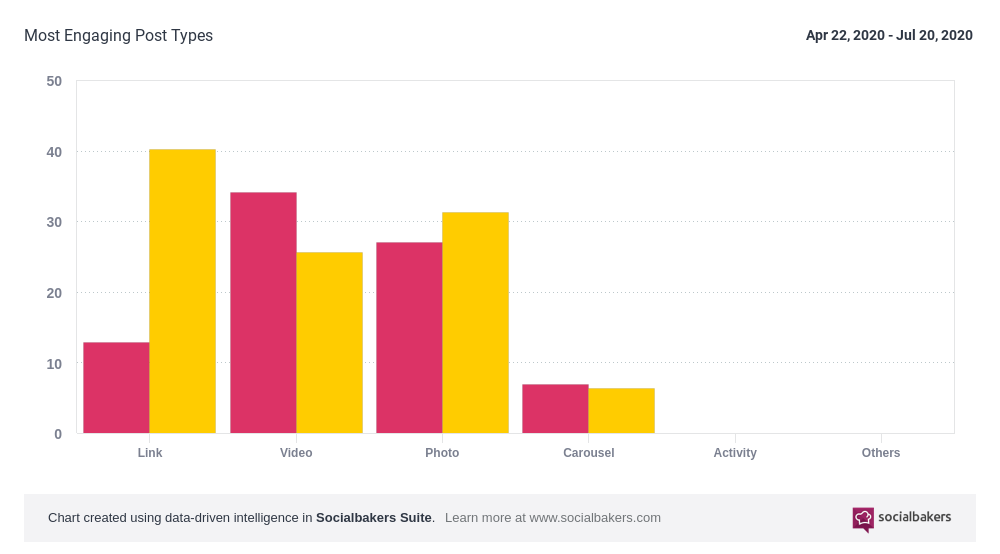
In the following chart, you can see a head-to-head comparison the most engaging of post type on Facebook for the selected time range of the last 90 days.
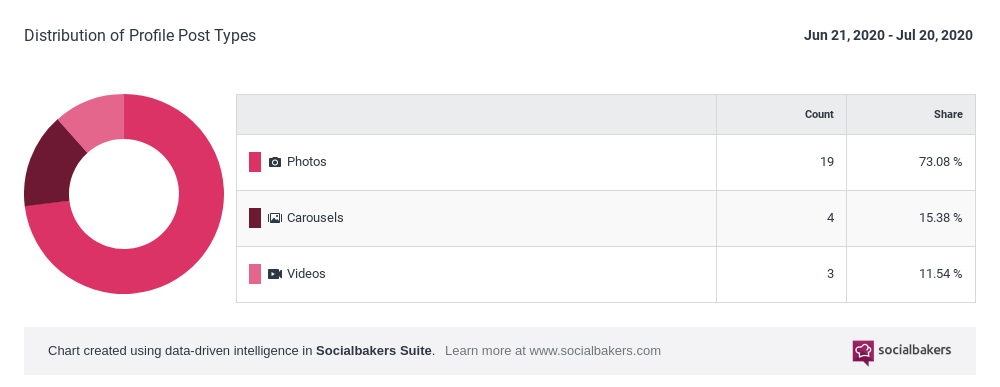
In the following chart, you can see what the distribution of post type on Instagram is for the selected time range of the last 30 days.
In the following chart, you can see the Number of Views for a selected YouTube channel for the selected time range of the last 30 days. Many of the AI-powered content recommendations can be found here, and should be leveraged to make better content decisions, invest in top-quality content, and spot patterns in engagement to develop an evergreen content strategy.
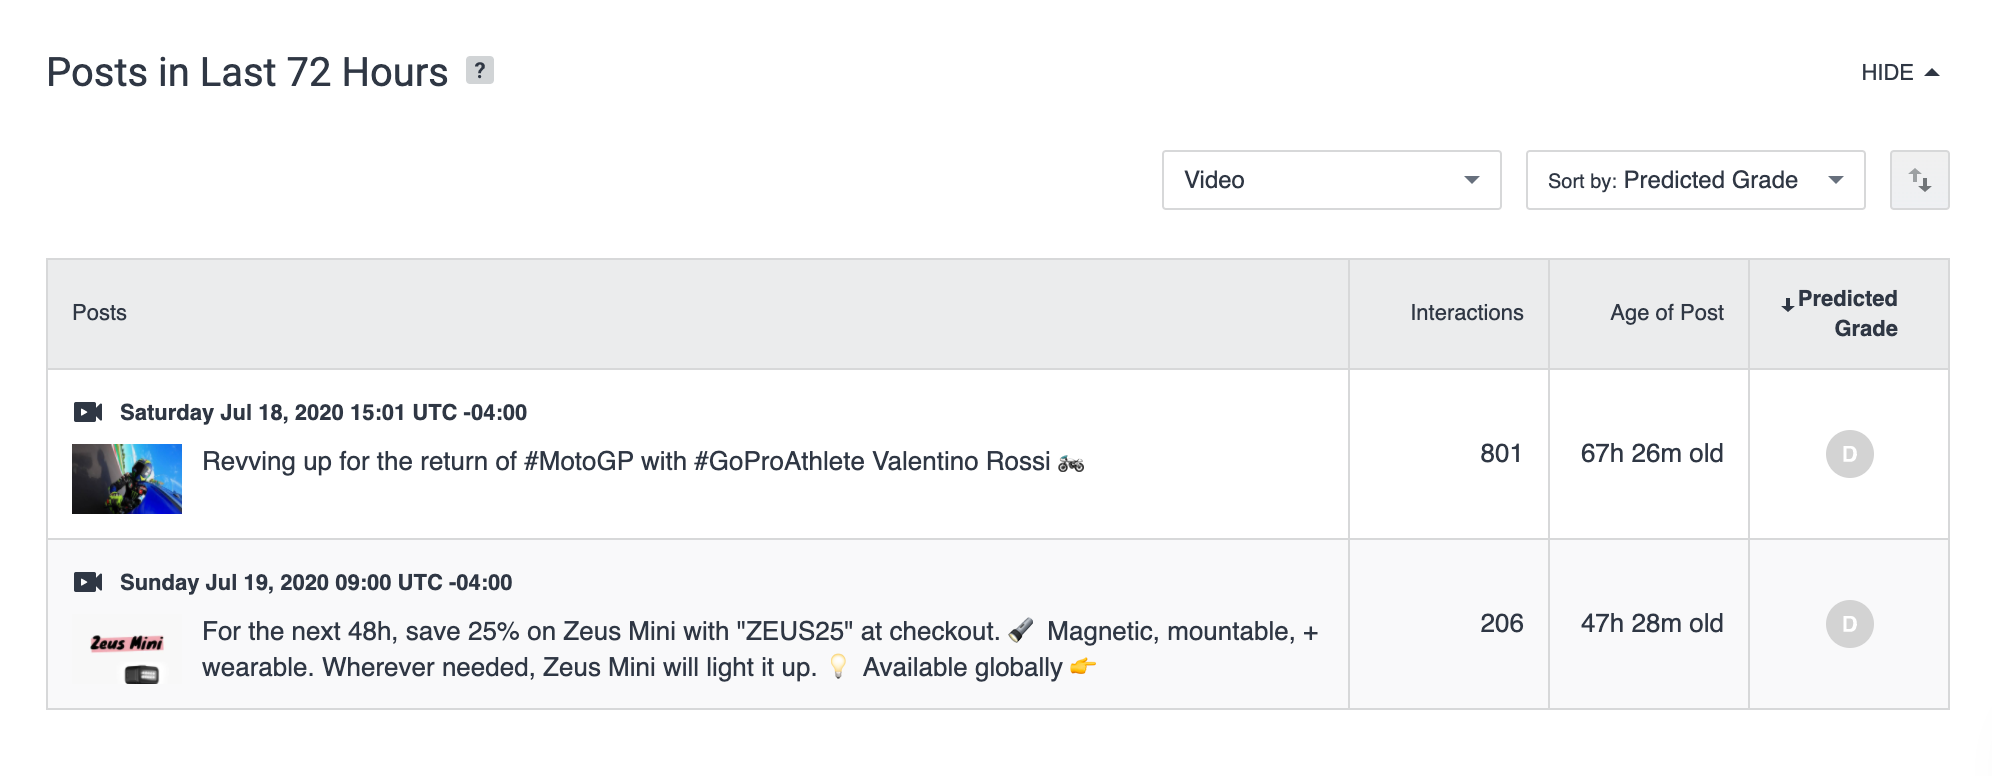
In Performance Prediction, every organic post is automatically assigned a quality grade from A+ to D, evaluated based on the post’s potential performance. In this instant, AI makes content analysis straightforward and user-friendly. To hone in on your best performing videos, simply filter the Posts in Last 72 Hours table by Type.
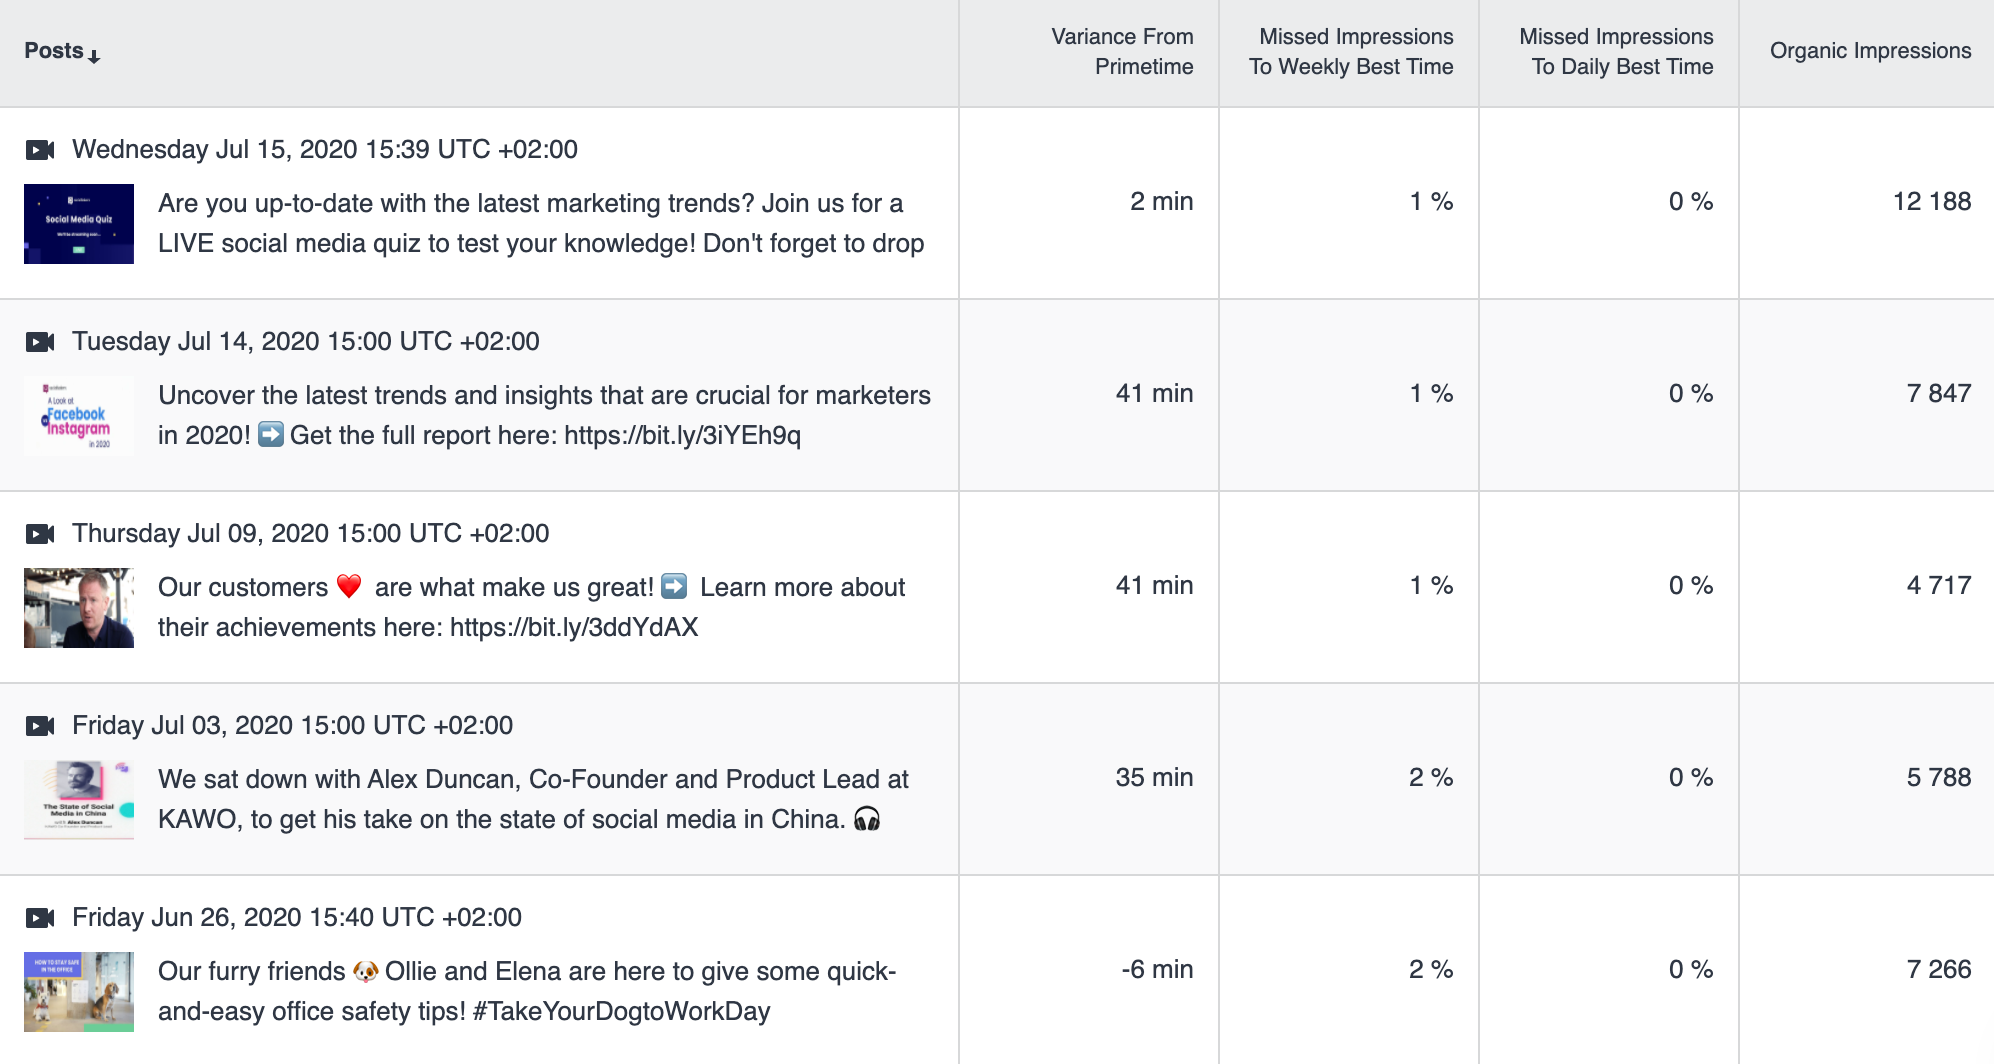
To get better at posting videos at the right time, check in on PrimeTime tab too. The content table can also be filtered by content type, allowing you to see just how much your actual posting time varied from PrimeTime recommendations and the subsequent missed impressions due to this variance.
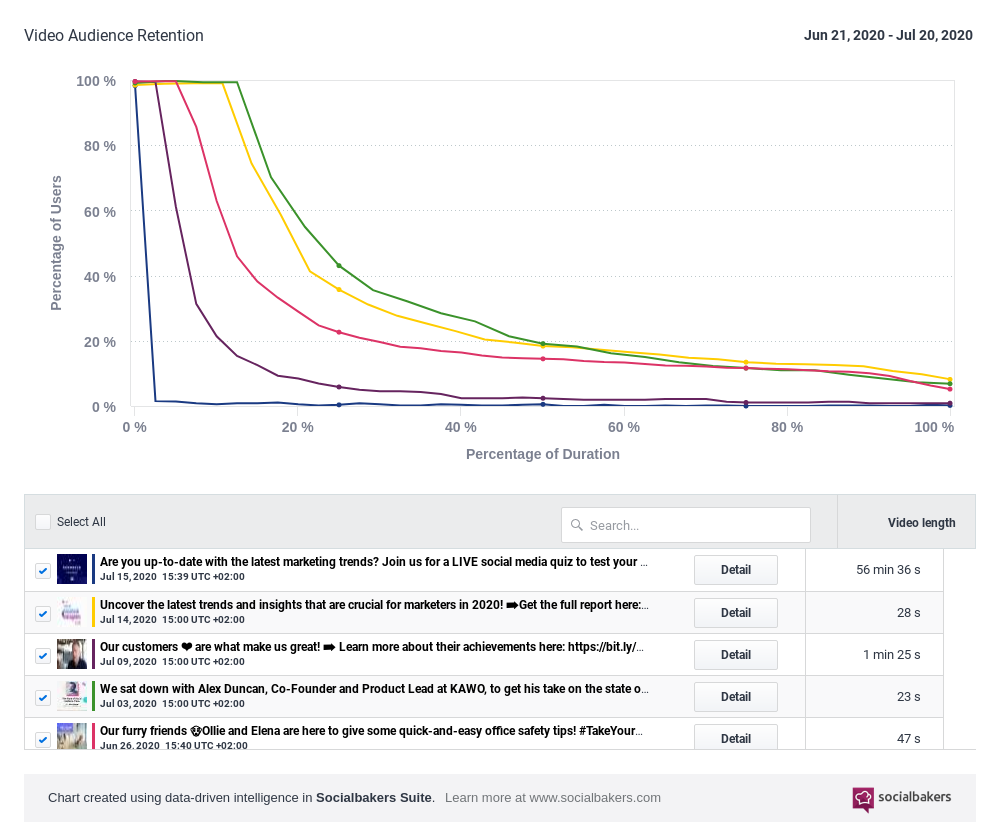
In the specific video performance section of Insights for Facebook, a variety of metrics are ready for analysis, including:
Video Audience Retention
Total Time Watched
Video Views
Unique vs Repeat Views
Auto-played vs Click to Play Views
10-second Views
10-second Unique vs Repeat Views
10-second Auto-played vs Click to Play Views
30-second Views
30-second Unique vs Repeat Views
30-second Unique vs Repeat Views
Video Benchmarks
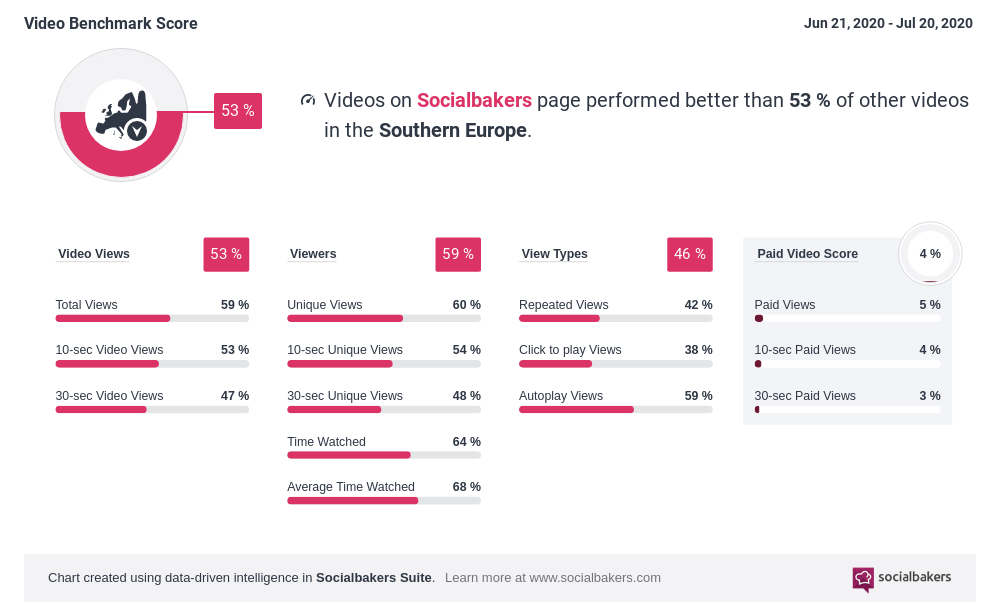
In the Video Benchmarks section of Analytics, you can benchmark the performance of your Facebook videos against Industries (20), Countries (9), and Regions (13). Learn more about how benchmark categories are defined in Benchmarks - Industry Categories and Regions.
Seeing your private video performance metrics in a larger context is key when building a competitive video strategy. By leveraging these unique insights, you can set more ambitious goals and rise above the pack to deliver the ROI you’re counting on. Video benchmarks allow you to learn just how well your video performance stands out in the crowd against the following categories:
Video Views: Total, 10-second, 30-second views
Viewers: Unique View, 10-second Unique View, 30-second Unique View, Time Watched, Average Time Watched
View Type: Repeated Views, Click to Play Views, Autoplay Views
Paid Video Score: Paid Views, 10-second Paid Views, 30-second Paid Views
Video Analysis in Content Hub
Content Hub is the go-to place for holistic content insights, easily accessible for quick and painless content analysis. Content Hub's unified content feed allows you to analyze all profiles (Owned, Public, and Influencer) that you've added to the platform. Filter content using the search bar or advanced search options. For video analysis, filter by items such as Platform, Media Type, and Facebook Video Types (Crosspost, Crosspostable, Live, Shared). Analyze videos with video-specific metrics such as: Video Reach & Views, View Time, and Video Retention. Tip: Create a "Saved search" to easily jump into the same analysis view time and again.
Looking at Video Reach & Views shows total video impressions and reach, and allows you to understand performance at each stage of the video view funnel: from 10-sec video views to completed views. Understand precisely how long people are watching and when they are jumping off. For videos that were posted from several Facebook profiles (so-called crosspostable videos), compare performance on the selected profile vs. performance across all profiles by switching from This Post to All Posts.
Diving into View Time gives you insights into the total view time, average time watched, and allows you to dig into countries or audience demographics. Again, for crosspostable Facebook videos, you can compare performance on the selected profile vs. performance across all profiles by switching from This Post to All Posts.
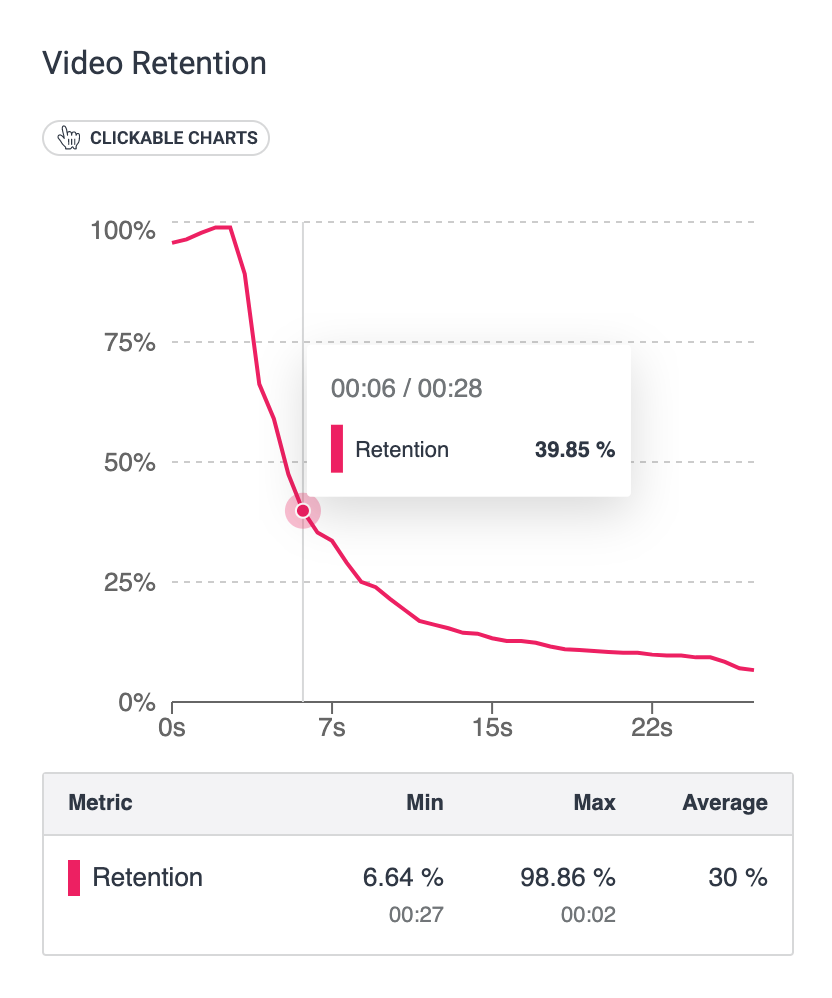
The third option, View Retention, is a great way to learn more about view patterns of Facebook Videos. With an interactive chart that evolves as you hit the video play button, identify what the audience is responding to, spot spikes, drops, and see exactly when people stop watching.
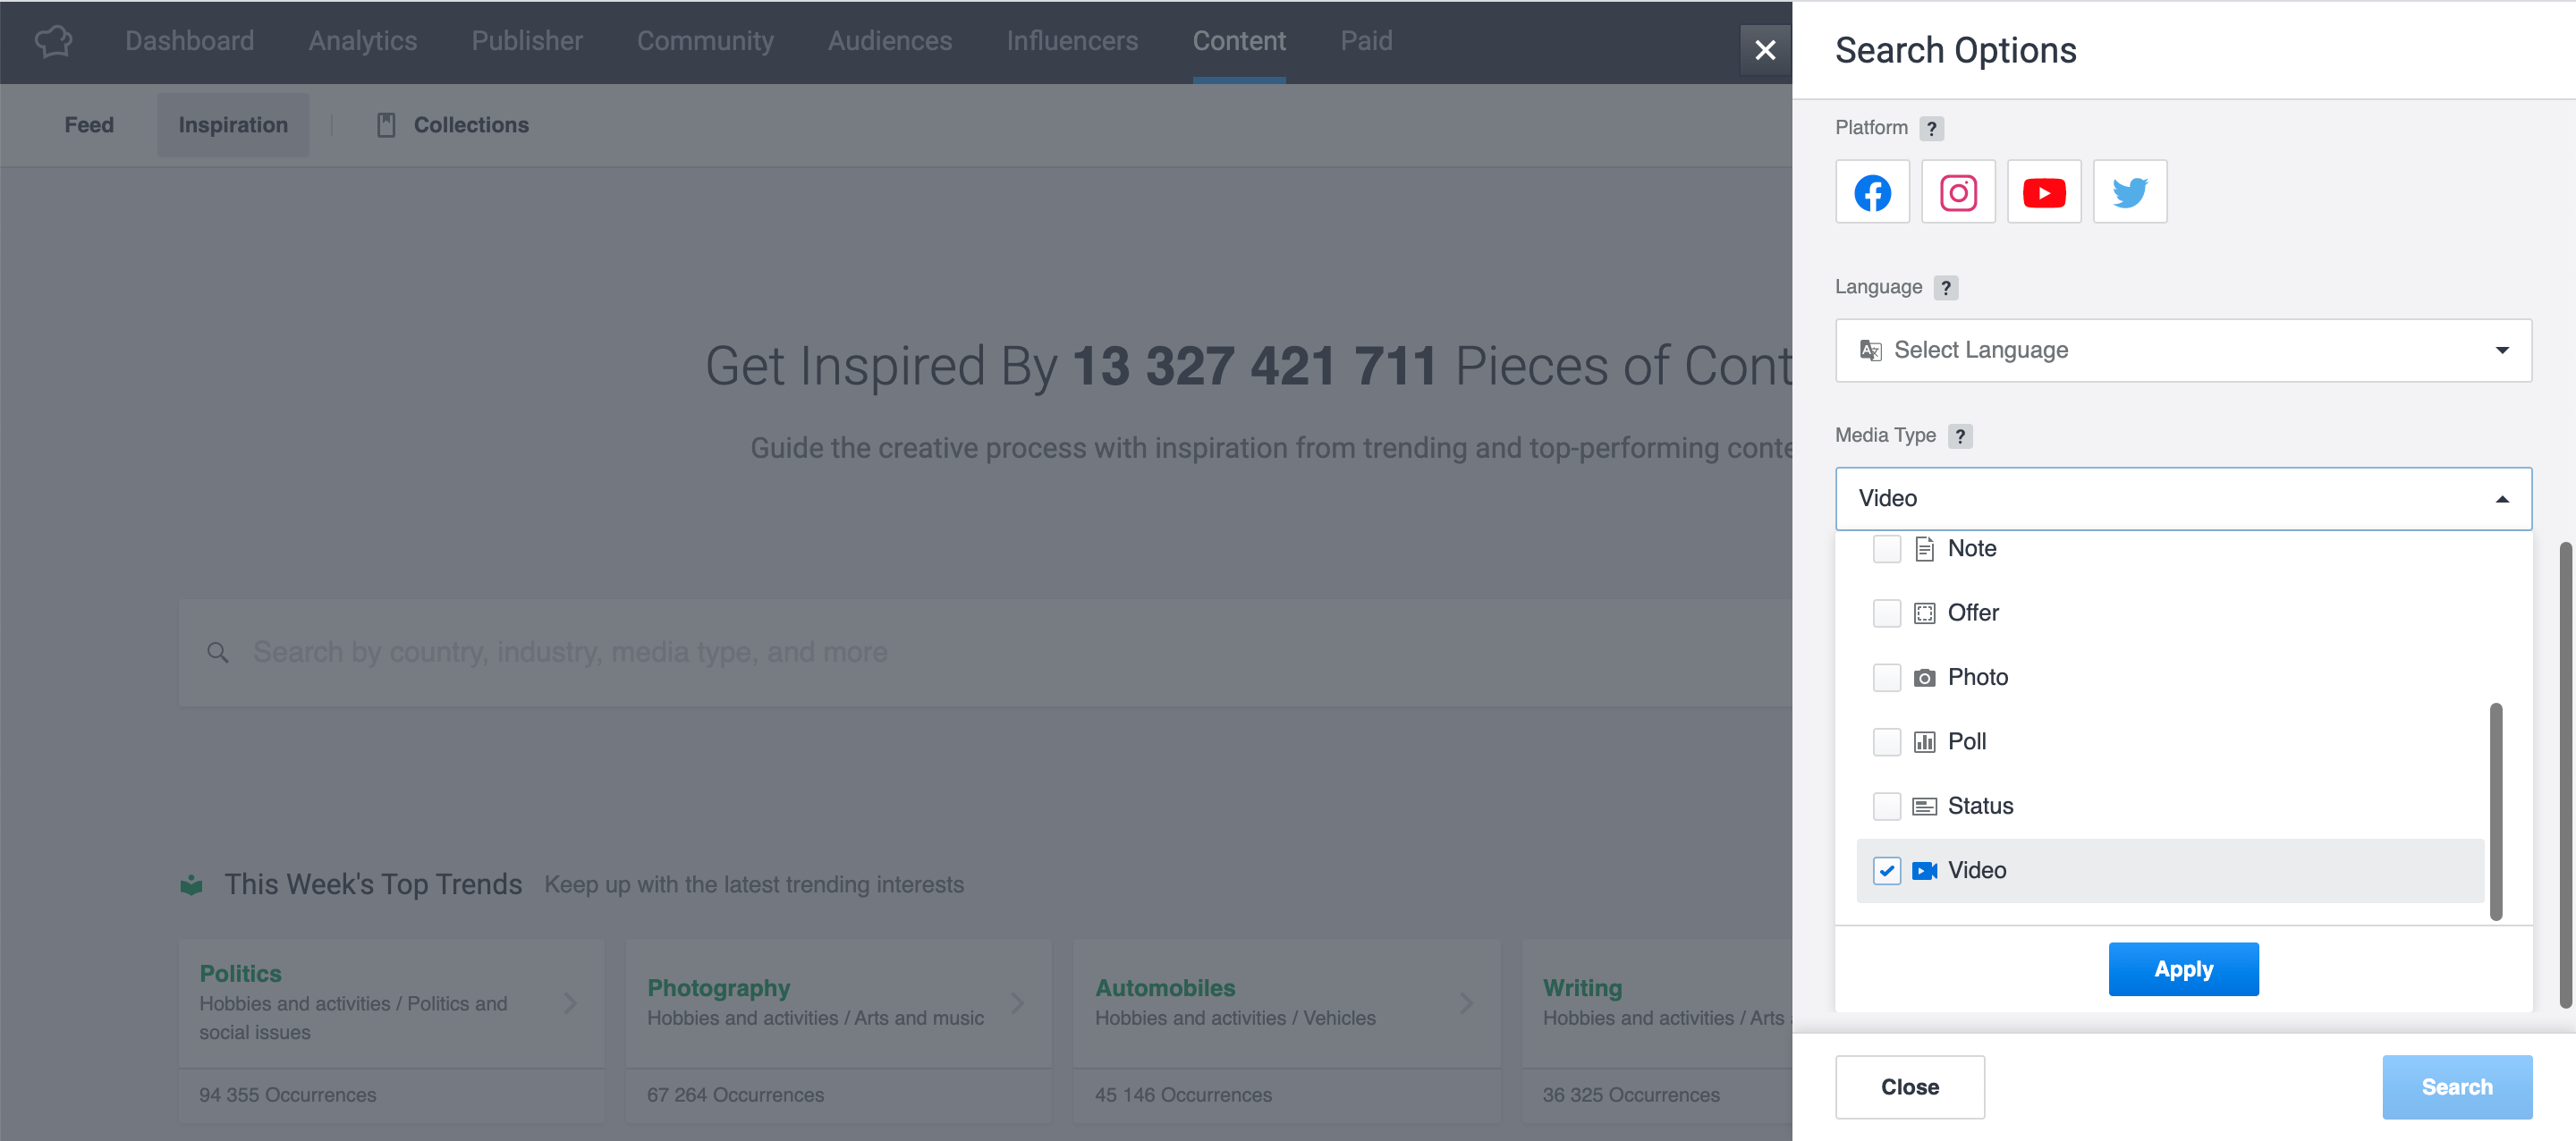
Video Trends Tracking in Content Inspiration
Content Inspiration allows your teams to search and discover top-performing content across open social (FB, IG, TW, YT), using keywords and filters to get honed results. Having quick, comprehensive access to what’s trending on social is key; and focusing analysis on what your specific audiences like is the golden ticket, allowing you to create content that will make fans and followers stop mid-scroll to engage with your message. It's easy to search Content Inspiration by Media Type: Video to discover top video content.