With Executive View, you can track the impact of your Facebook activities on your broader digital and business goals.
How much value is my Facebook activity generating?
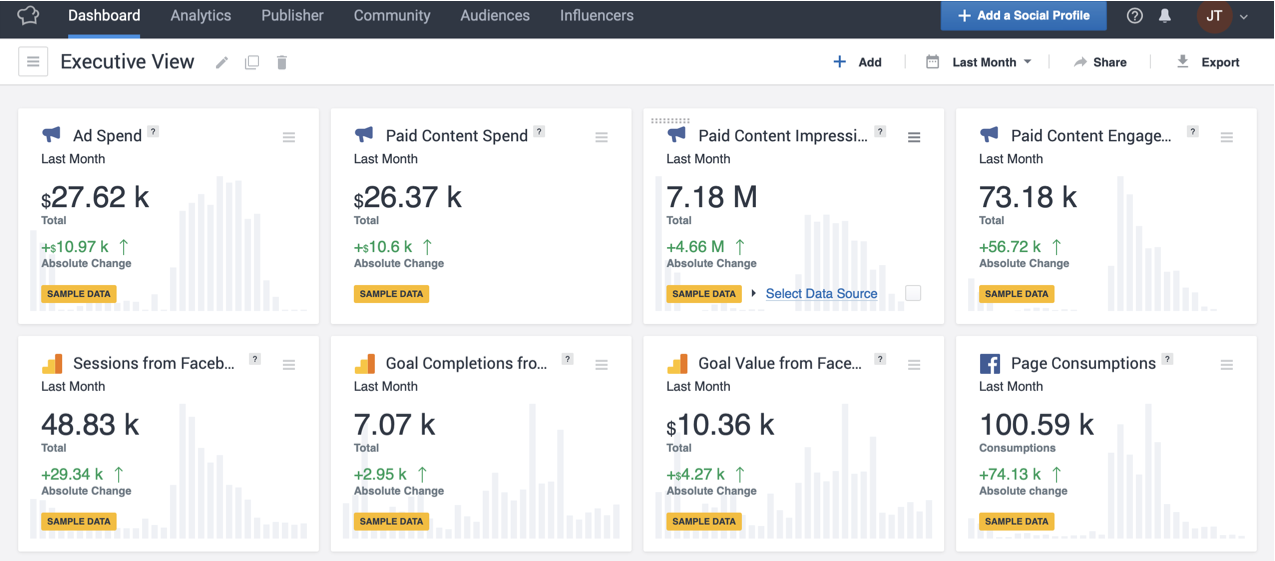
The Executive View dashboard is pre-populated with widgets to help you understand how your Facebook activities are creating value.
Compare all the money you invested in your Facebook paid activities and track your website performance. Here’s how:
-
Look at your total spend on Facebook advertising and how that’s evolved over time in Total Facebook Ad Spend.
-
Look at how Website Traffic from Facebook is evolving. The website widgets present all the traffic from Facebook, both paid and organic.
-
See how many times your Goals (defined in Google Analytics) were completed by visitors referred from Facebook.
-
Look at how much value your Facebook audience generated for your business in Goal Value from Facebook. (You must have values assigned to your Goals in Google Analytics.)
Is the content I promoted actually engaging my audience?
-
Paid Content Ad Spend shows how much budget you allocated in post promotion and how your spend changed over time.
-
Paid Content Impressions shows the number of impressions received by your promoted content, while Paid Content Engagement shows the total number of interactions it generated.