How to Measure Facebook Performance Against Competitors
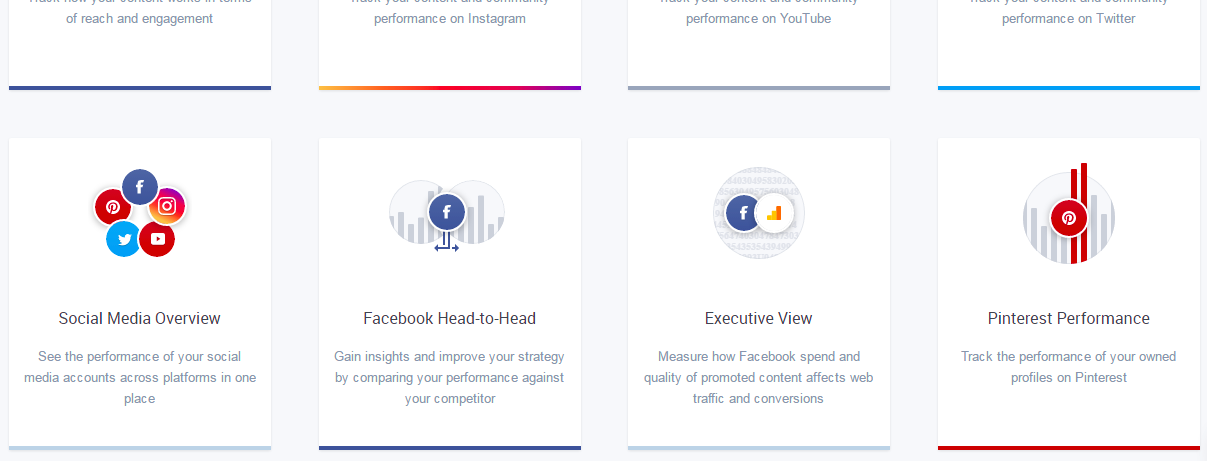
In Dashboard, you can set up a competitive analysis of your chosen Facebook profiles within seconds. Simply click Dashboard and then select the Facebook Head-to-Head template.
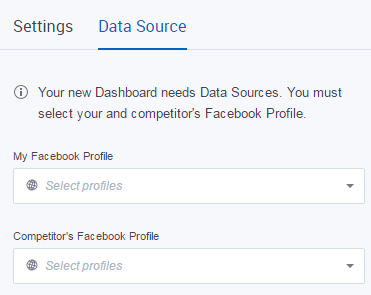
Go to Data Source and use the drop down menu to select your and your competitor's Facebook profiles.
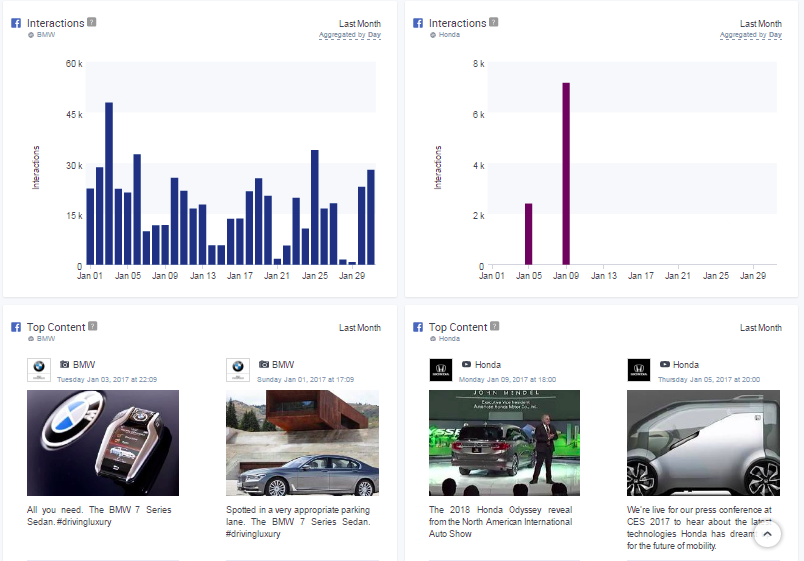
After selecting your competitor's profile, the template instantly presents you with a side-by-side comparison of key metrics - such as Growth of Total Fans, Interactions and Top Content.
All Dashboard templates are easy to customize. You can start personalizing by adding, deleting or editing individual widgets within the template. If you wish to change how your data appears in individual widgets, you can select from three visualization options: Value, Evolution or Comparison.
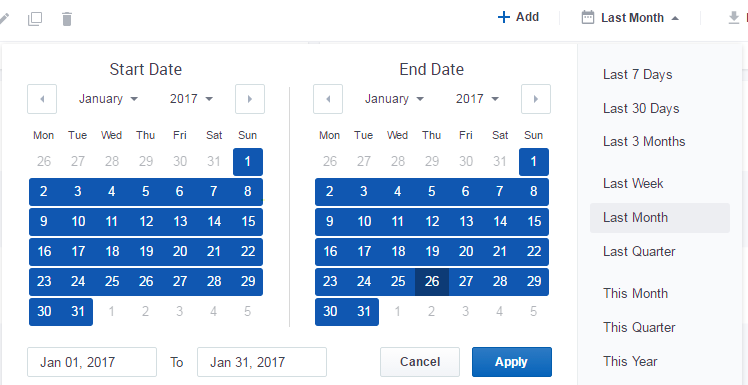
You can also set the date range for all widgets within the template or customize the date range for individual widgets.
The Dashboard allows you to use widgets to make metric to metric comparisons. Just select the metric you want to see a comparison for and press the Comparison button located inside of each individual widget.

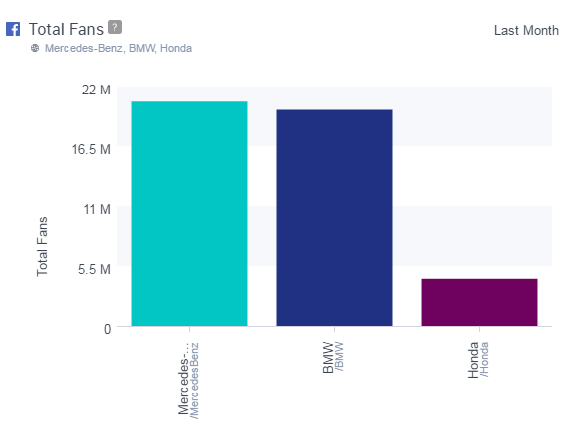
After selecting the Comparison visualization option, you will be able to select multiple profiles at once to see an illustrated comparison in one single widget. This instantly shows you how different profiles are performing for specific metrics.
Once you have created the perfect template or custom Dashboard, you can export your results or share access to your Dashboard with your team members.

