How to Leverage Paid Analytics in Emplifi Suite, Step by Step
Get complete and unified oversight of all your paid ad accounts with the Paid Analytics Module. Accessing your paid data in one place makes it so simple to analyze, report, compare insights and confidently discuss future advertising strategy based on data truths.
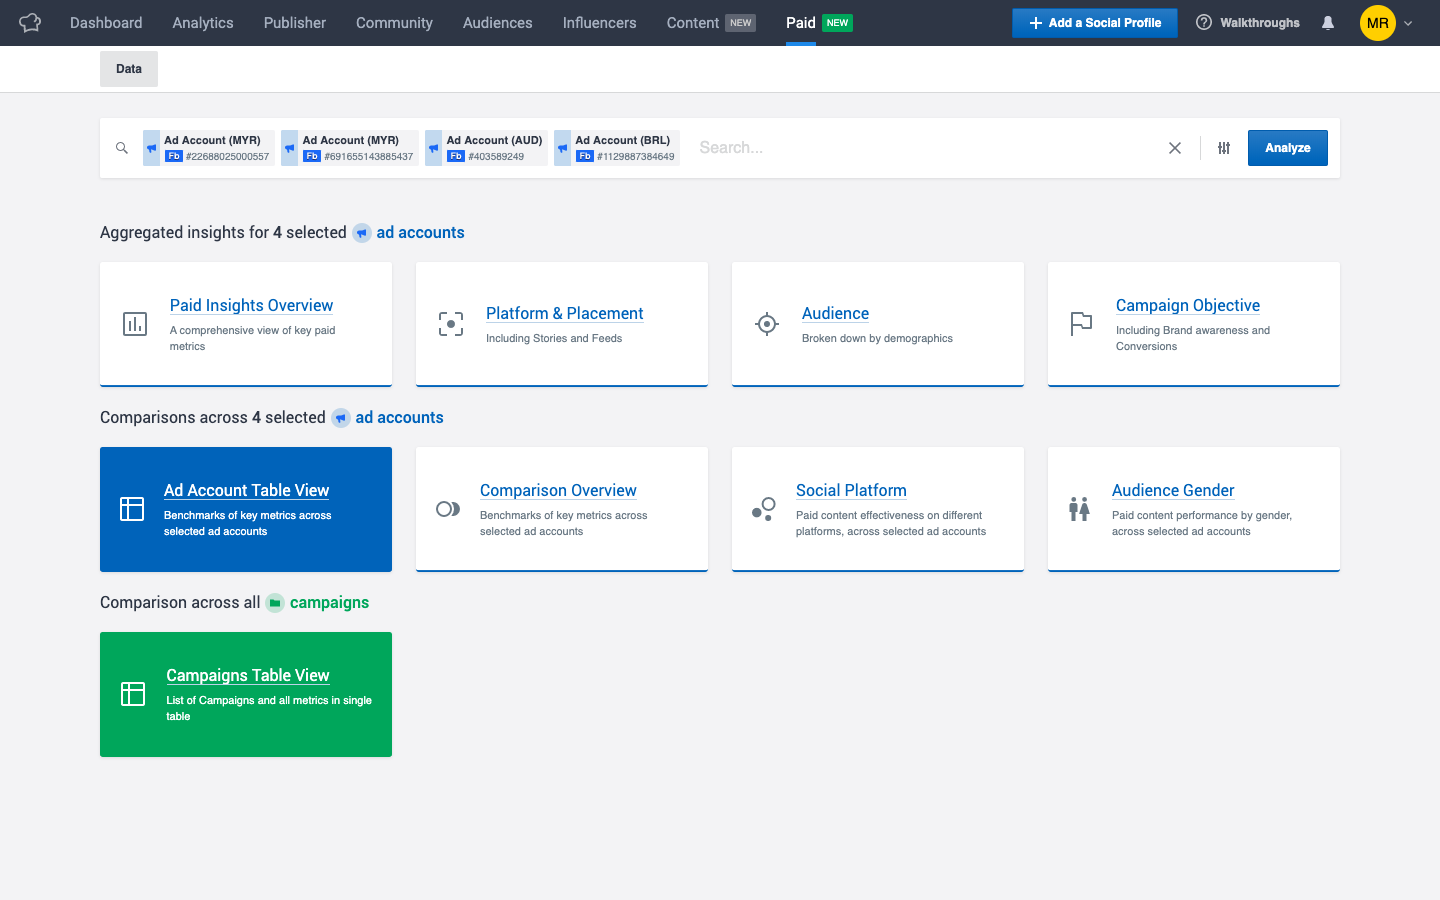
For Ad Account level insights, simply select the accounts you'd like to analyze and you'll be presented with various view options for these selected Ad Accounts. You'll have the option to view insights for the selected Ad Accounts in aggregate or as a comparison. For data-backed performance analysis, break down your spend and other key paid metrics (CPC, CPM, Click-through rate, Frequency, Impressions, and more) by audience demographics, social platform, ad placements, and campaign objectives.
Aggregate by:
Insights Overview
Platform and Placement
Audience
Campaign Objective
Or compare multiple ad accounts by:
Performance Overview
Social Platform
Audience gender

With instant oversight into your paid activities, you will be able to lead meaningful conversations about your Ads performance, with supporting data backing your strategy.
Bring greater visibility to discussions, with easy-to-analyze charts, tables, and metrics. Dig into campaign data as it comes in, seeing and comparing your most critical ads metrics at a glance, learning from highs and lows to improve next time around. In Paid Analytics, you can analyze key paid metrics and spend across all your paid campaigns. Let's check out the workflow, step by step:
As with Ad Account analytics, simply select the ad accounts you’d like to analyze, and a new section of paid analytics will appear.
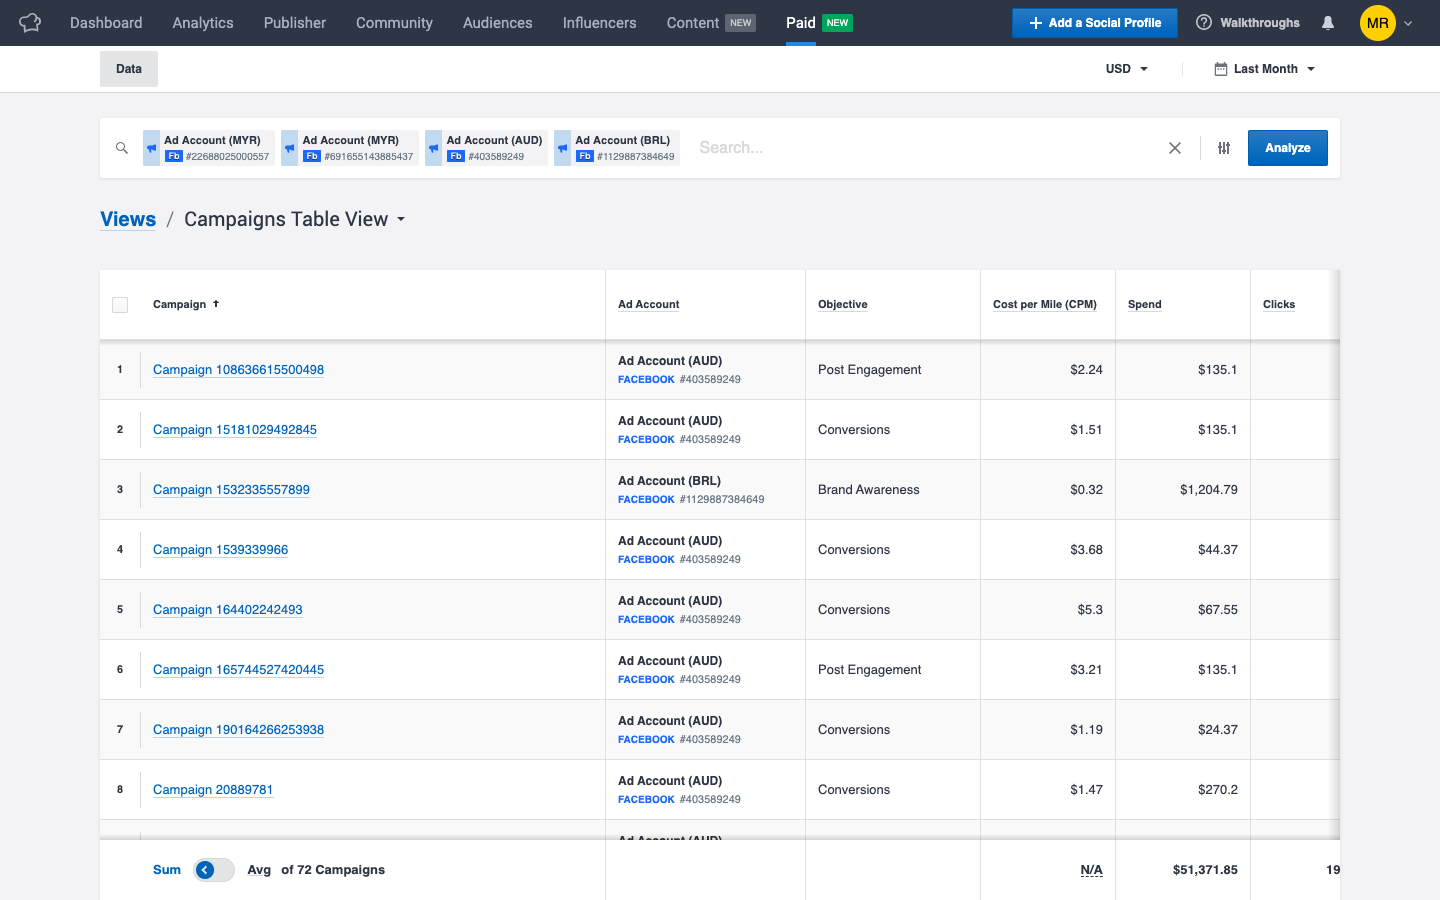
Click on the Campaigns Table View option, and in an instant, insights for the campaigns executed from your selected ad accounts are displayed. Once you land in the table, review all performance metrics (Ad Account, Objective, Spend, CPC, CPM, CTR, Clicks, Frequency, Impressions, Reach) at a glance. Drag and drop these columns in the order you’d like to see them.
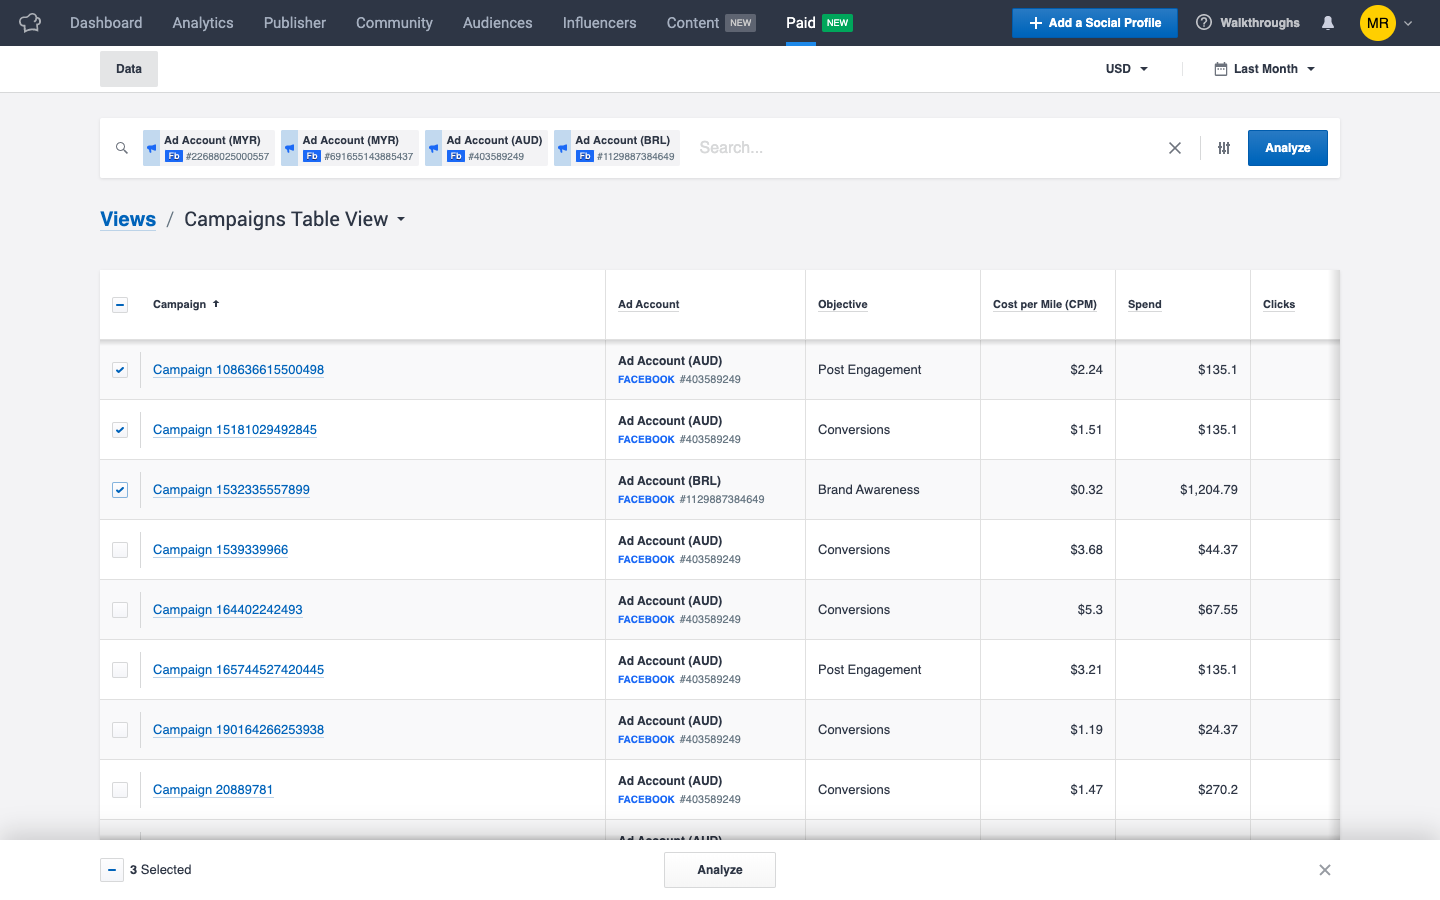
To further focus your campaign analysis, use the checkbox to the left of each campaign. Select your preferred campaigns, then click Analyze. You can select as many campaigns as you'd like. For multiple selections, the Analyze button will be at the bottom of the table.
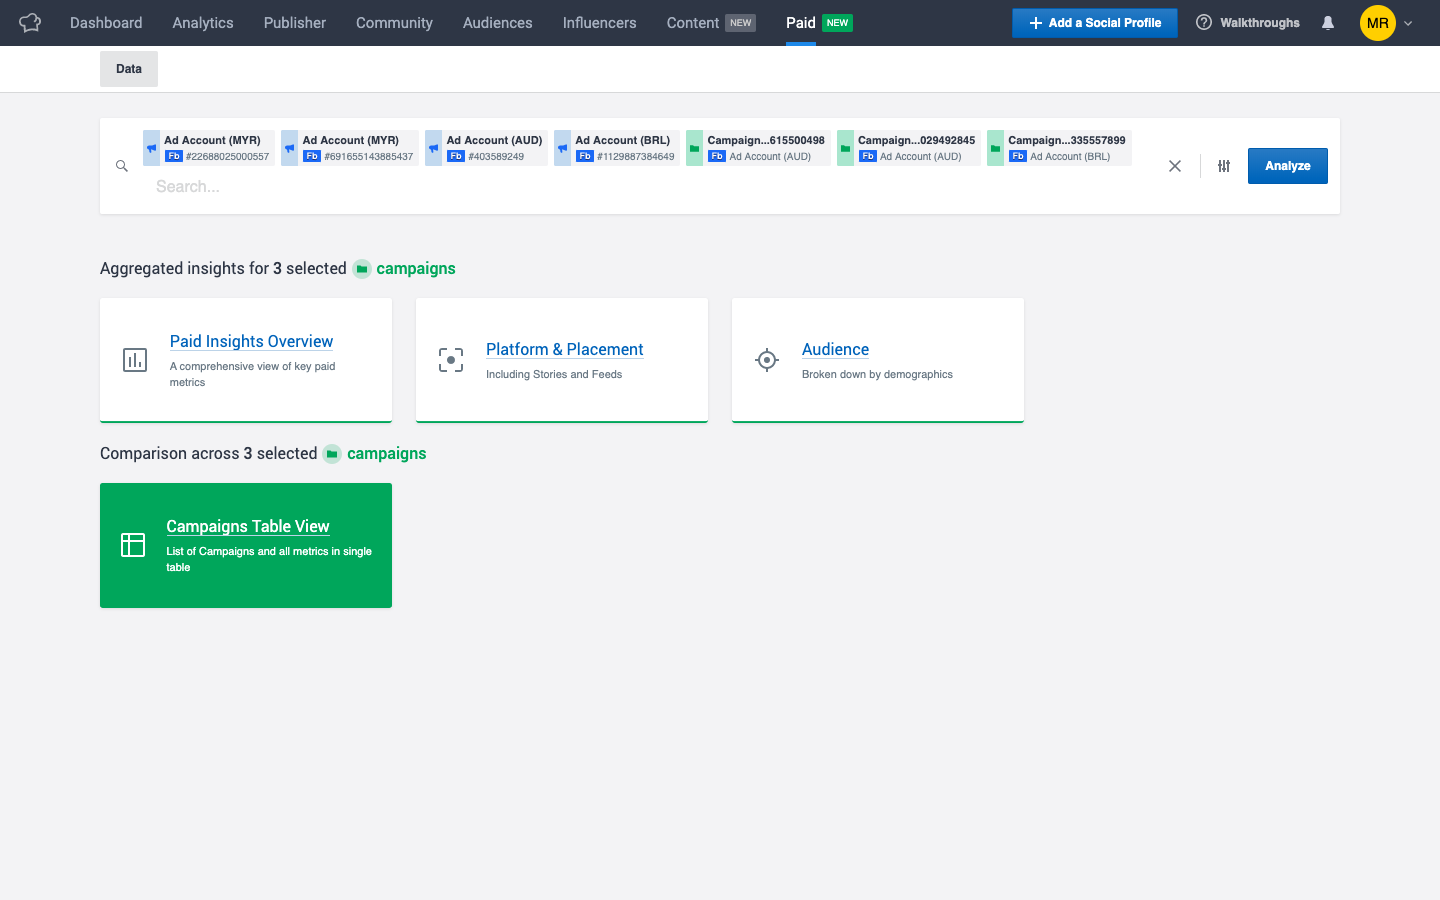
Once you click Analyze, you’ll be given the option to check out aggregate insights on these campaigns from various perspectives, including Platform & Placement and Audiences.
Customize your analysis. You can choose a date range and currency right in the module. To set your preferred currency for this module, you can also head to Settings and set it more permanently.
You can also decide how to aggregate the data, by day, week, or month. In an instant, results are recalculated. Here, results are aggregated by Day.
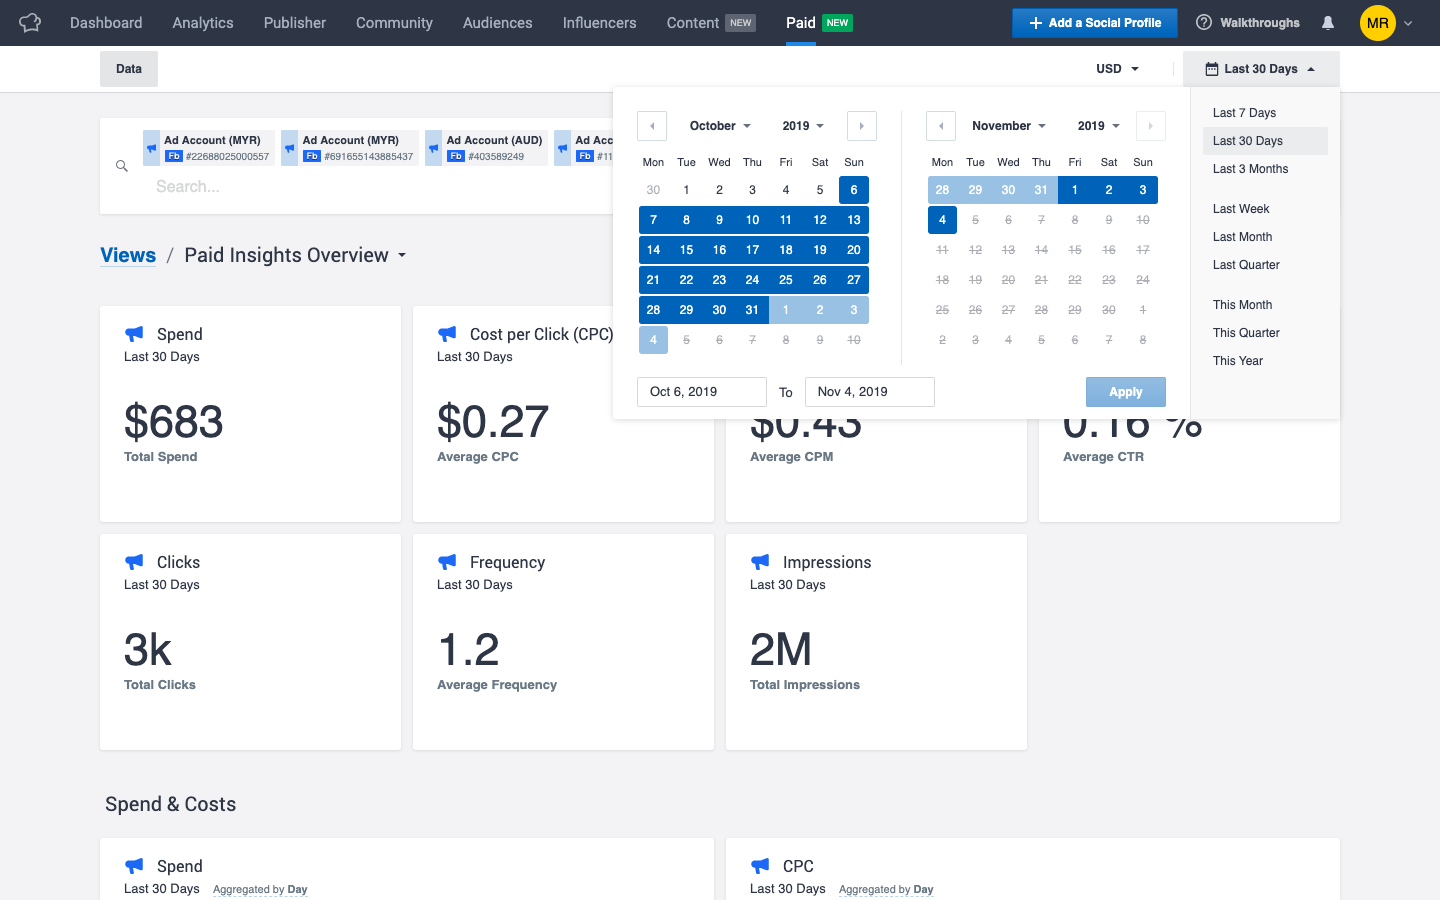
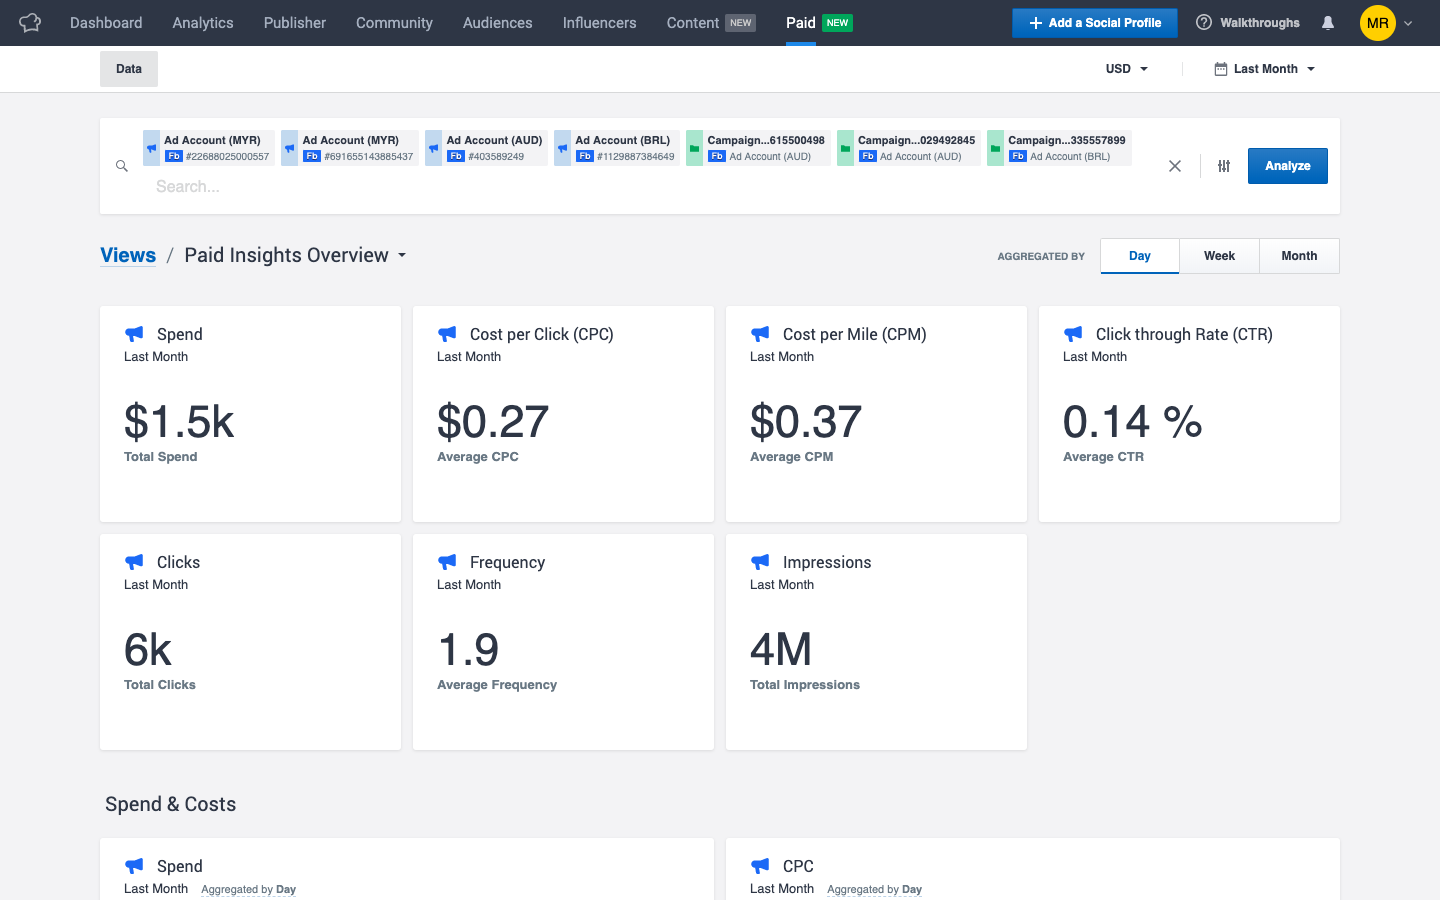
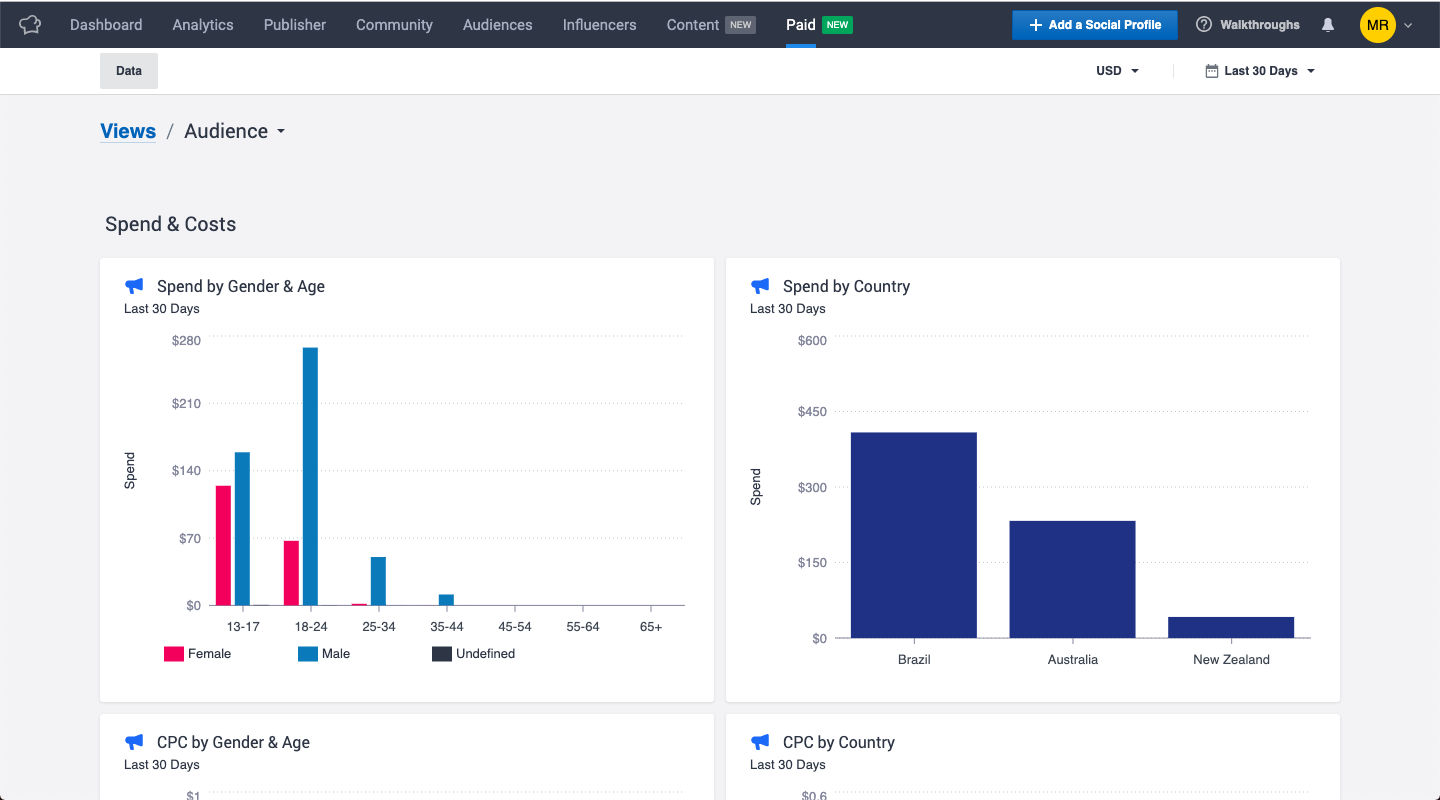
Click into Audience to learn more about the demographic breakdown of your paid activities and spend. You can dive into Audiences on a campaign level and an Ad Account level.
Easy access to your most valuable assets improves the entire paid marketing workflow. With Paid Analytics, your teams are empowered to make smarter and quicker decisions. To get started, make sure your ad accounts are connected to the platform by going into Settings -> Channels -> Ad Accounts.
