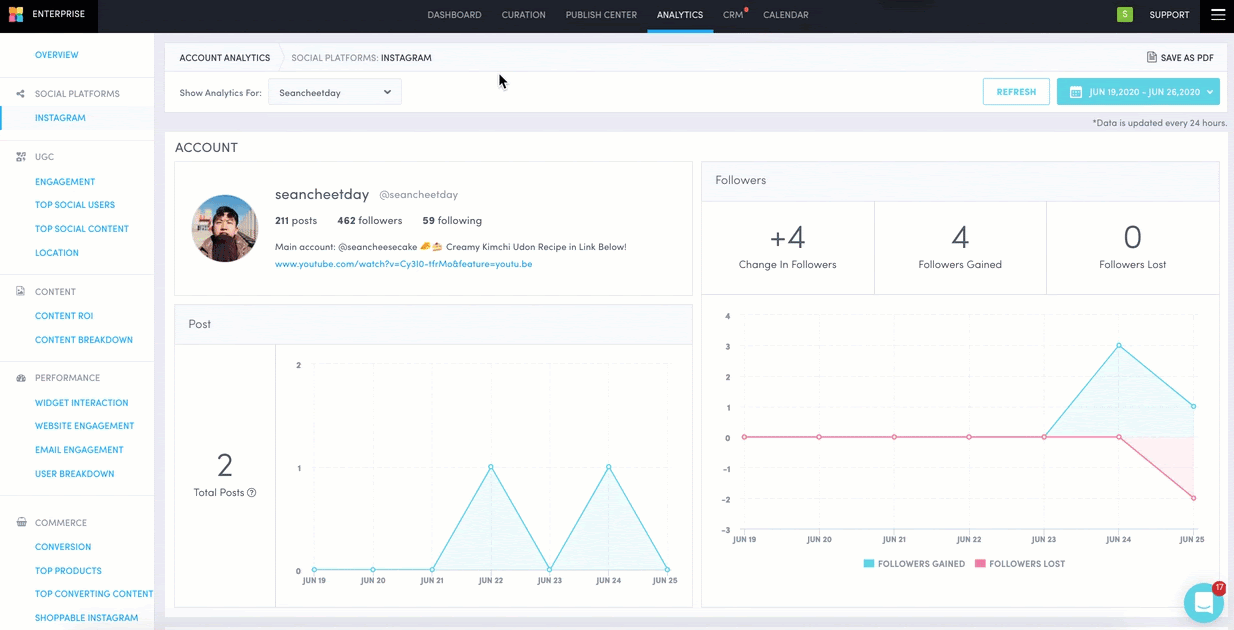
We are excited to announce our newest feature - Instagram Social Analytics! With Pixlee’s Instagram Social Analytics you’ll get an overview of the top metrics for your Instagram business accounts, broken down to show both daily and total counts. You can find this in the Analytics section of Pixlee under the new “Social Platforms” header.
With the report updated daily, this feature enables you to easily:
-
Switch between Social Analytics for your Instagram business accounts
-
Save the page as a PDF file and change the date range to enable easy and customizable sharing
-
Gather data from an assortment of interactive charts:
-
Total Posts - made with your account
-
Followers - amount gained and lost
-
Engagement - total number of likes and comments
-
Engagement Rate - total number of likes and comments divided by followers divided by posts
-
Profile Views - total number of users who have viewed your account
-
Website Views - total number of taps on the website link in the account’s profile
-
Impressions - total number of times the account's media objects have been viewed
-
Reach - total number of times the account's media objects have been uniquely viewed
-
Ensure that you have an Instagram User Handle Collection set up for each Instagram Business account you have connected to Pixlee, in order for us to provide you with accurate engagement data.
Check out the product tour of this new feature here.
If you have any questions or feedback, please let us know via Emplifi Support or through the in-app chat!