Video Performance in the Analytics Module
For more information on video analysis across the platform, see Video Analysis in Emplifi.
Video is a key component of your Facebook strategy. However, in order to create excellent video content, you need to be aware of what is consistently working with your community so you can repeat this success. Video Insights in Emplifi Analytics can help.
If you haven’t activated Facebook Insights in Emplifi Solutions yet, now is the time to do so. After you enable Facebook Insights, head over to the Insights section in Analytics and click on Video.

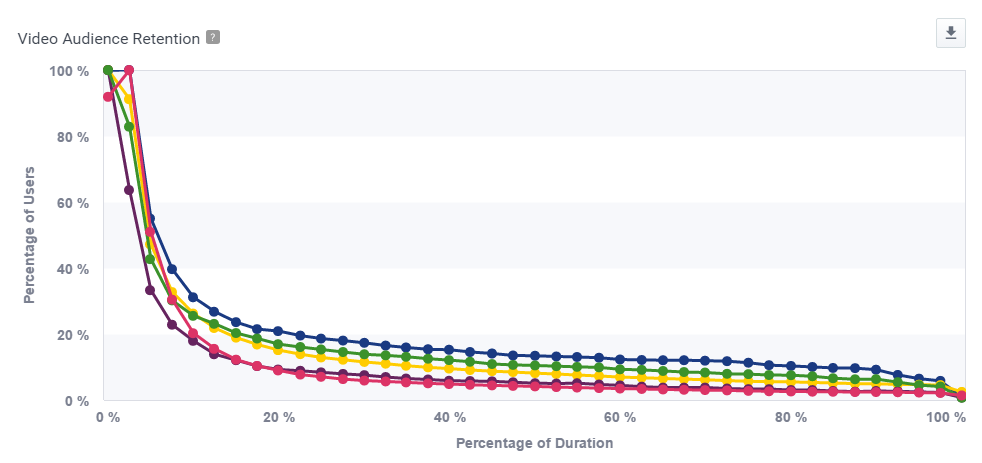
Once you are in the Video Insights section, take a look at the Audience Retention chart. This chart enables you to see a visual illustration of your audience's behavior. Here you can easily evaluate where viewers tended to stop watching each video you posted.

Using the data gathered in this chart, you can experiment with various video formats, duration, content types and more - to see how these components affect audience retention.
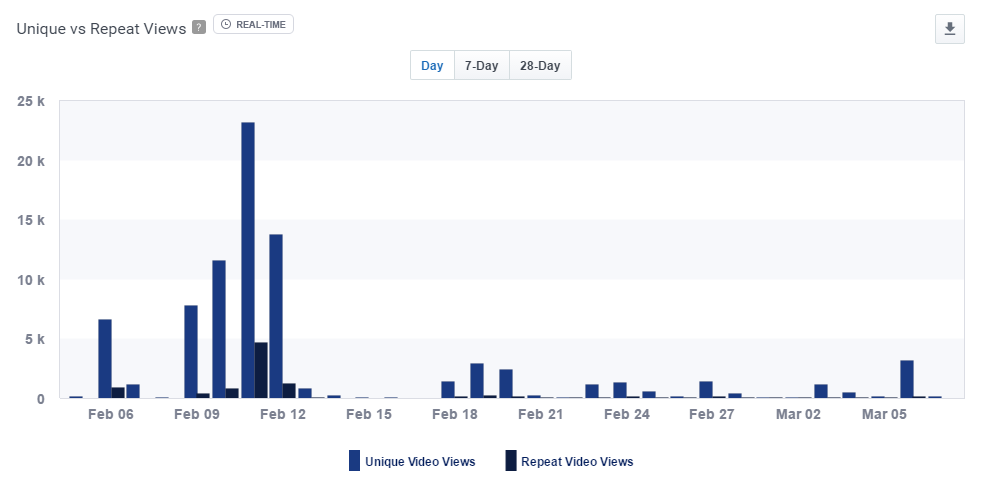
You can also look at charts such as: Unique vs Repeat Views or Auto-played vs Click to Play Views to get an understanding of how your audience is interacting with your videos.

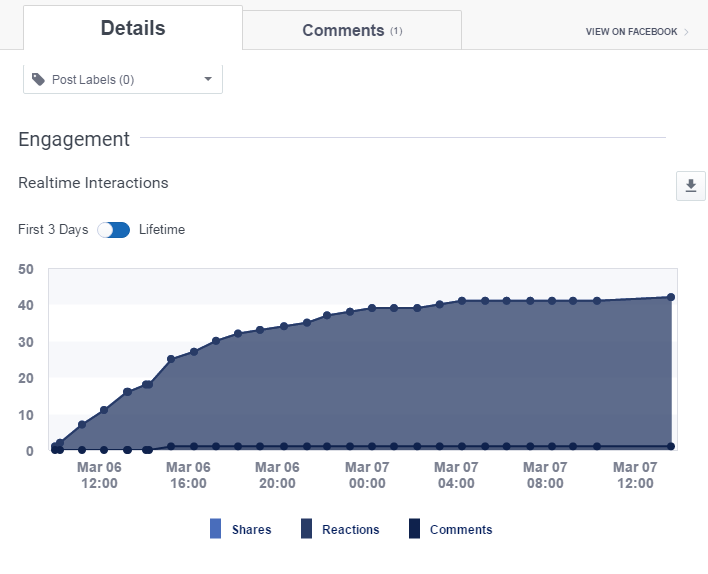
Finally, when you scroll to the end of the Video Insights page, you can see a feed of all your videos along with the key KPIs. Click on Details to get access to even more KPIs, such as Real Time Interactions.

Your data can be easily exported in any format (PDF, PNG or XLS). To download it, just click on the Export button at the top of the page.
