Set Up The Right Content Mix
In order to strategize effectively, you need to be able know what your competitors and overall industry are doing on social media. To discover your own strengths and weaknesses, you can benchmark yourself against other pages, which will allow you to adjust your posting strategy accordingly.
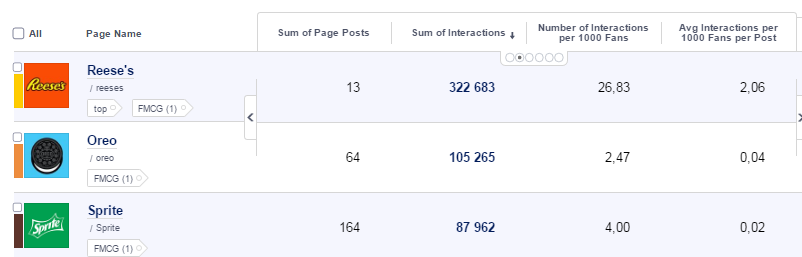
Number of Posts, Interactions vs. Interactions per 1000 fans vs. per post
When comparing the performance of multiple pages, you should look at the following metrics: Number of Posts, Engagement, Engagement per Post, during the same time period.
In the example below we can see that Reese's has the most efficient strategy. A clear indicator of their optimum performance is their posting strategy. Though they post the least - they receive the most interactions.
However, you must always take into account a Profile's audience size in relation to their interactions. In this example, all three pages have different audience sizes. Reese's has over 12 million Fans, Oreo over 40 million Fans, and Sprite over 20 million Fans. Because there is such a variation in audience size, we need to use the metric Number of Interactions per 1000 Fans to get a clearer picture of each brand's performance. In this case, we are able to determine that Reese's has the most effective strategy compared to the other profiles.
Dividing the aforementioned metric by number of posts, we come up with the Avg. Interactions per 1000 Fans per post. Again Reese's appears to be the best performer. In contrast, Sprite has the lowest index, which is caused by its high number of posts. To improve, Oreo should post less and focus more on quality rather than quantity.
Of course, creating shareable content is perhaps the most sought after because it helps increase your reach. You should always benchmark shareability with industry and regional benchmarks to see where you stand.
Don't forget to evaluate best-performing post types and posts in your industry and among your competition, so that you can keep ahead of social media trends.
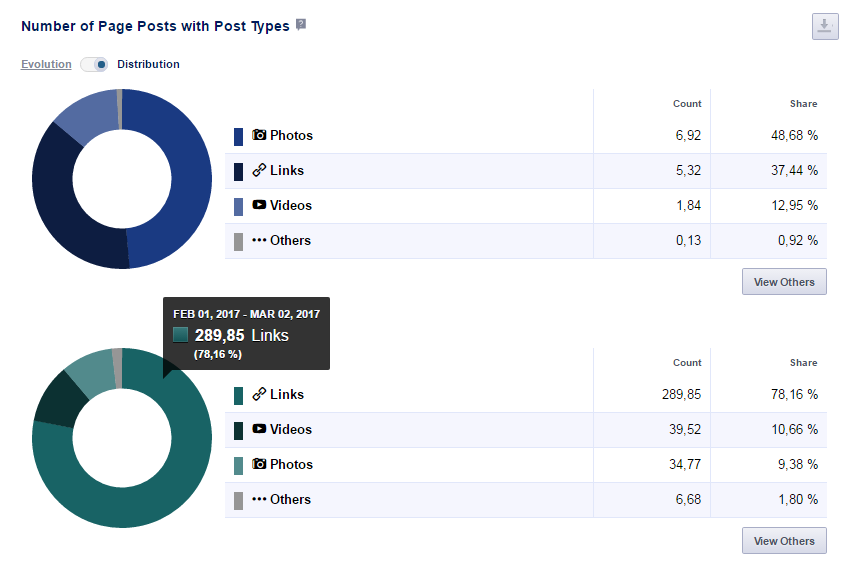
Example: Take a look at the comparison of Global Brands (blue) versus Media (green) in the image below. For Media the dominant Post Type are Links. They post nearly the same amount of Videos as they do Photos. Global Brands, on the other hand, prefer Photos, which represent almost half of their posts. Links are their second most common Post Type.
You should also track and evaluate engagement for both global and local pages. It is important to note that local pages often have better engagement as their Fans are more accurately targeted. After tagging pages with industry/regional labels, you can use Labeled view to see how those pages perform against each other. This will help you understand how you are performing in your key markets.