Dashboard allows you to track the efficiency of your paid Facebook activities and their impact on wider business goals. Now you can expand your social media conversations. Instead of talking about specific metrics, such as Reach, Fan Growth and Engagement, you can build conversations around in-depth analyses of your digital performance.
With the integration of ads metrics in Dashboard, you can see whether the content you’re promoting is actually engaging your audience and find out how much value your Facebook activity is generating.
To find out if the content you are creating is successfully generating interactions, focus on metrics such as Paid Content Spend, Paid Content Impressions and CPM. These three metrics can help you understand the change in ad spend compared in addition to the total number of actions your paid content generated.
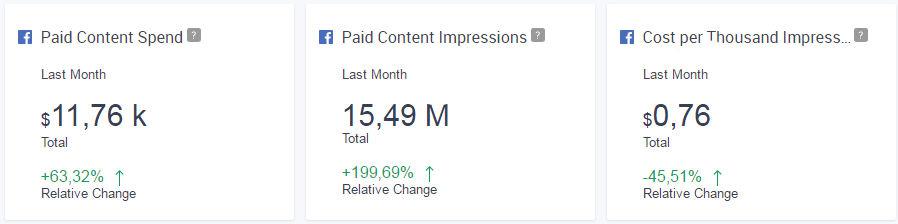
In this example, we can see that Paid Content Spend has risen by 63% and Impressions by nearly 200%. CPM on the other hand has decreased by 45.5%, which is proof that this promotion strategy is effective. You can also use the same process to analyze Engagement. Just compare Paid Content Spend with Paid Content Engagement and Cost per Engagement.
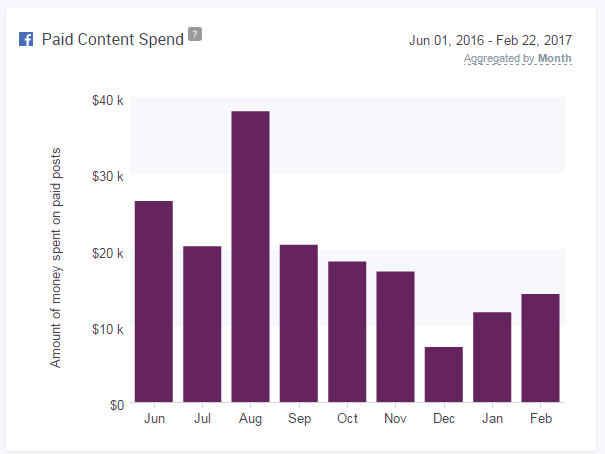
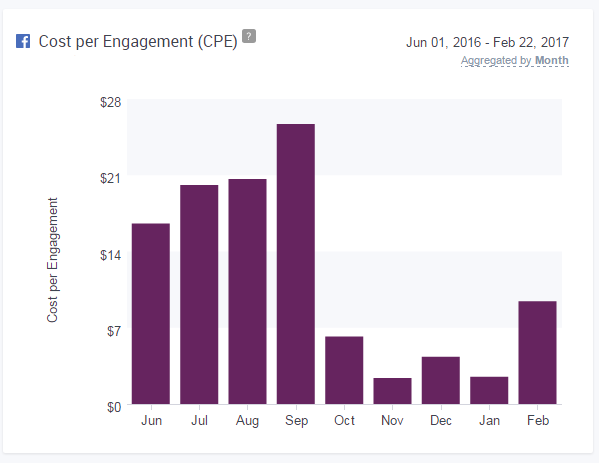
You can also track the evolution of your engagement over time to evaluate the efficiency of your Paid Content Spend. In the example below, we can see that since cutting the budget, after August this company has managed to increase their Engagement while decreasing their Paid Content Spend.
Maximized Engagement from October
Decreases their Cost Per Engagement since October.
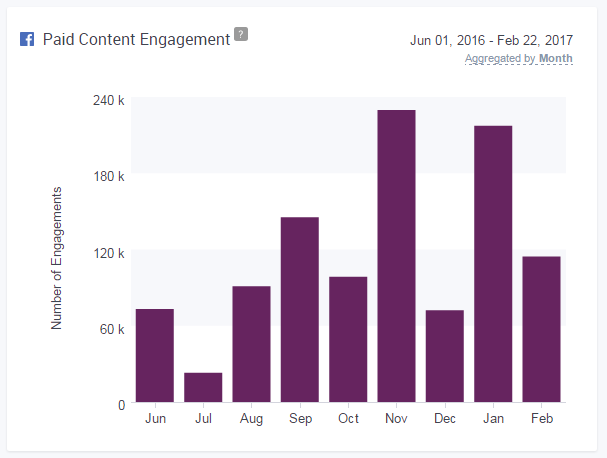
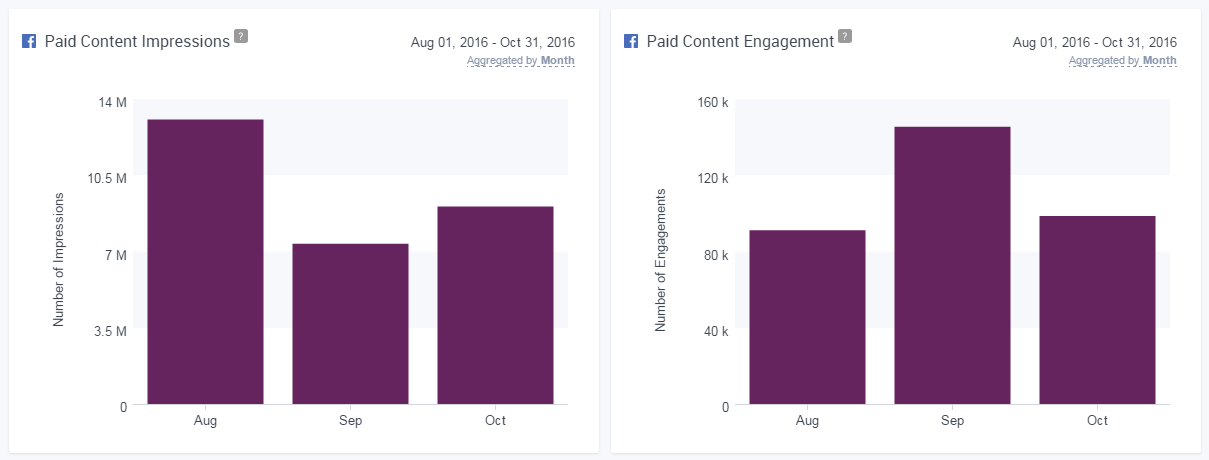
We also recommend also that you look at the Paid Content Impressions metric and Paid Content Engagement metric. In this example, we can see that although the Impressions for September were lower than Impressions in August and October, it was the highest performing month in terms of engagement. As a result, we can conclude that September had the most efficient boosting strategy.
Be sure to look at your website traffic and conversions to monitor the impact of your paid Facebook activities.
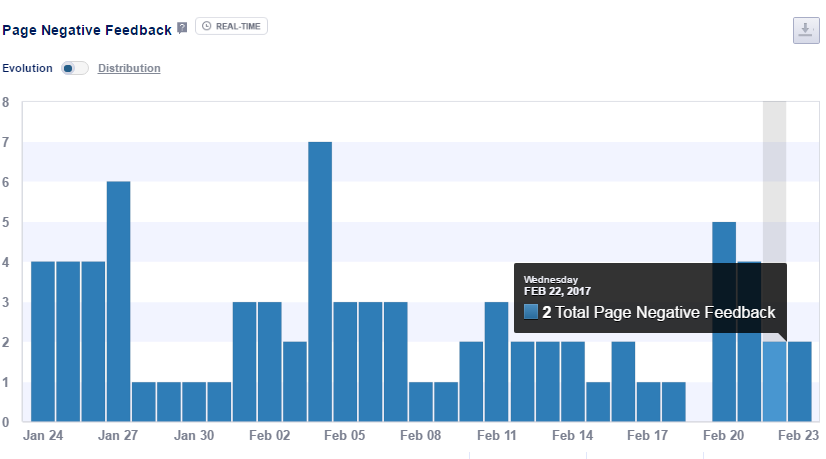
In the Ads Overview you can keep an eye on Negative Feedback. You should see a decrease in Negative Feedback if you are using Performance Optimization to help you make your promotion decisions.
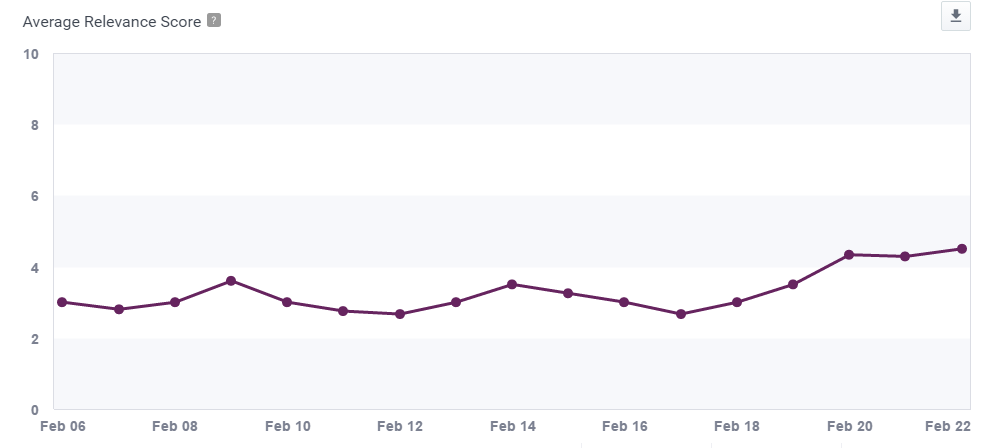
If you continue to optimize your content in terms of messaging and targeting, your Average Relevance Score will increase.