Drill into Interactive Widgets
Interactive widgets allow you to explore content that is behind the analytics data find the causes of a suspicious spike or reasons for a significant performance boost.
Drill down by focusing on specific value - content relationship
You can drill even deeper by clicking a specific bar in a chart and review the underlying content in the Content hub - sorted and aggregated based on your Unified Analytics board settings.
This allows you to see what exactly is impacting the analytics the most.
Steps:
Hover the cursor over the specific bar, or a section of the bar.
The View associated content pop-up appears.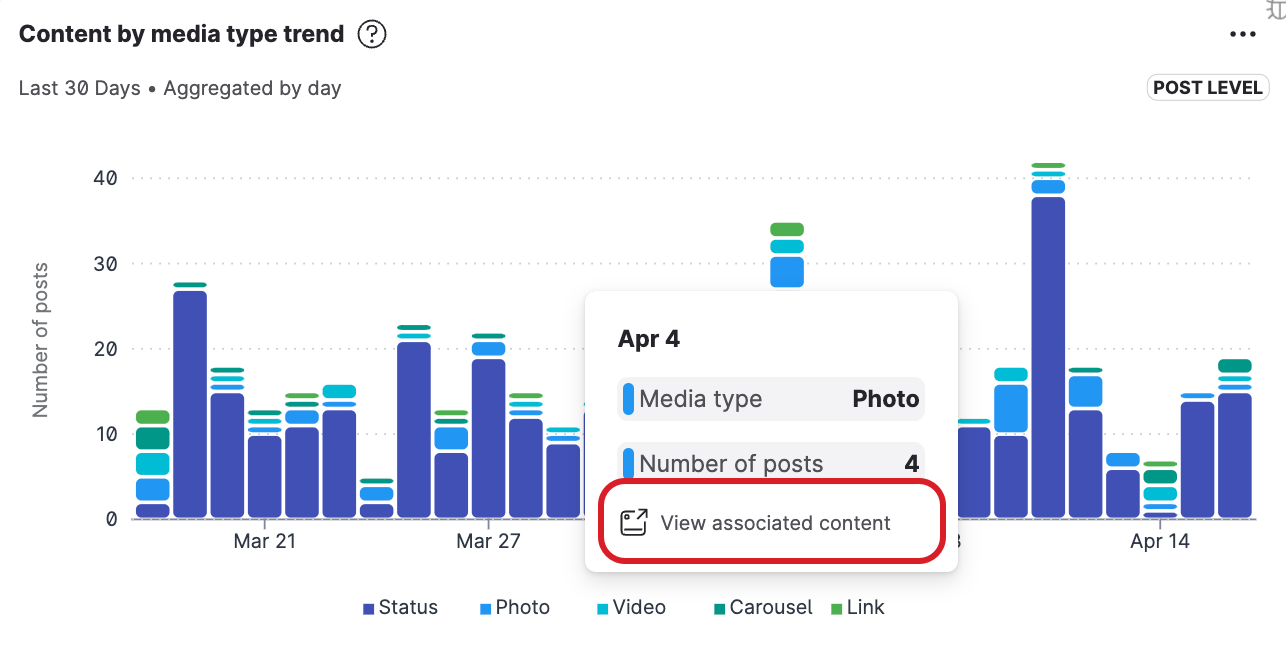
Click the pop-up.
The Content Hub opens focused on the specific content pieces behind the specific bar.
When Content Hub opens, you will see everything automatically sorted by the significant metric to help you find which pieces of content contributed the most to the result that you are exploring.
Display underlying content
You can also display the overview of the content for the entire widget:
Steps:
Position the cursor over an interactive widget.
The View in Content Hub icon appears.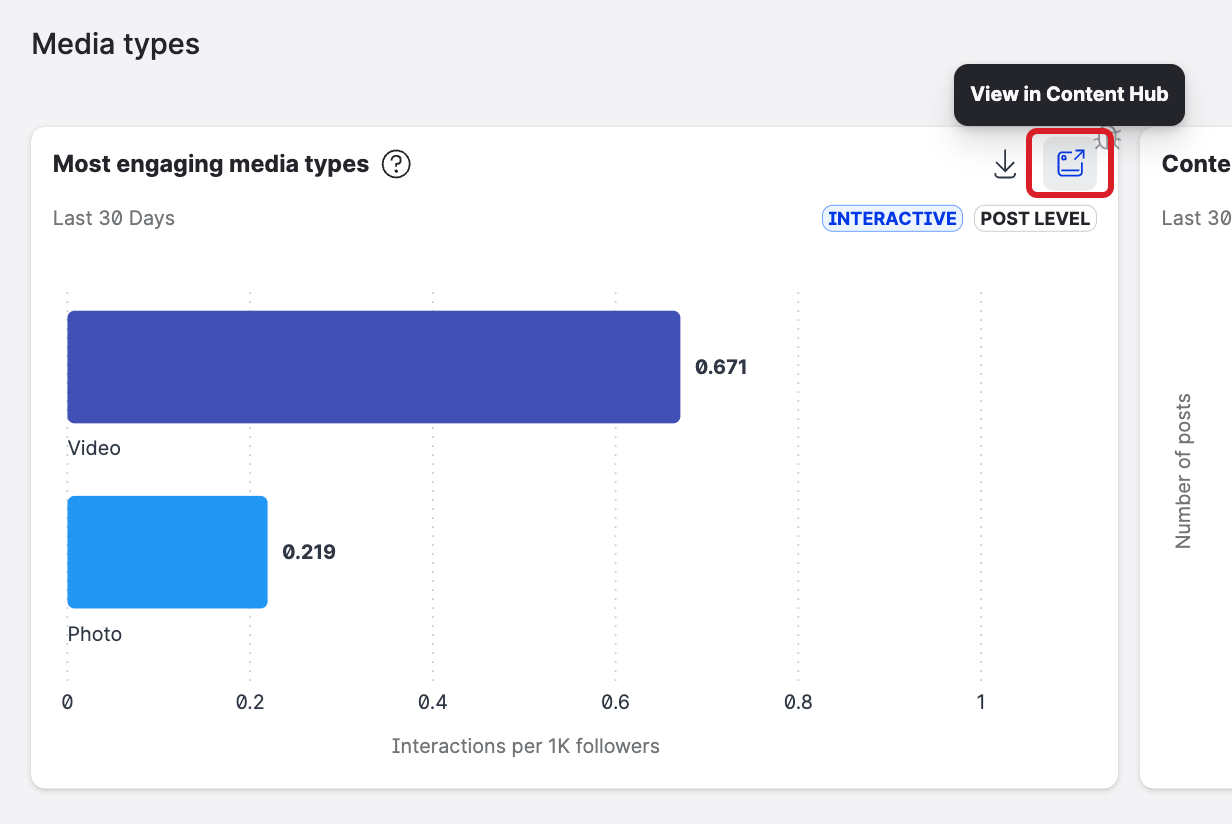
Click the View in Content Hub icon.
Content hub opens.Review the source content that the widget visualization is based on.