Track Competitors' Paid Strategy
Promoted Post Detection allows you to uncover your competitors’ paid and organic content on Facebook, allowing you to get an overview of the best posting strategies in your industry or region.
You can use Promoted Post Detection for one or multiple pages or profiles (Maximum 10). Simply select the page or profile you want to analyze or go to Comparison and select multiple pages or profiles there. Once you are presented with the Comparison, scroll over to the Promoted Post Strategy.
The Promoted Post Detection graph clearly illustrates the relationship between the amount of promoted posts and the interactions from these promoted posts.
It's best if your posts fall under the “Extremely beneficial promoted posts” area of the graph. This indicates that your promoted posts strategy is on the right track, and you are getting the optimal number of interactions for your money spent.
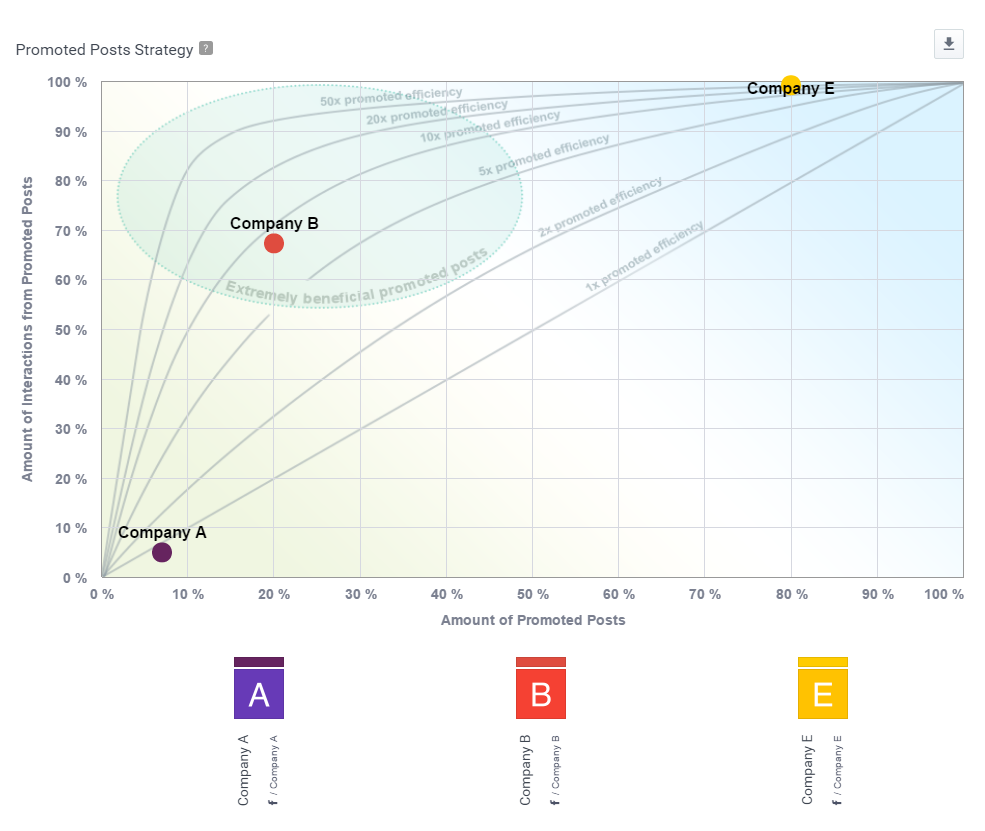
In the example above, we can see that Company A is in the bottom left-hand corner. This means that they aren't promoting almost any posts. In contrast, if your brand is in the upper right corner, you are over promoting your content and are not reaping the benefits. This indicates that you need to improve your promotion strategy - revisiting everything from timing to targeting.
We can see that compared to the other brands in the image, that Company B is promoting wisely. According to the graph, they are only promoting 20% of their posts, which are receiving nearly 70% of their Interactions. As a result, they fall under the Extremely Beneficial Promoted Posts area.
In addition, you can get a side-by-side comparison of the promotion strategy of your analyzed pages.
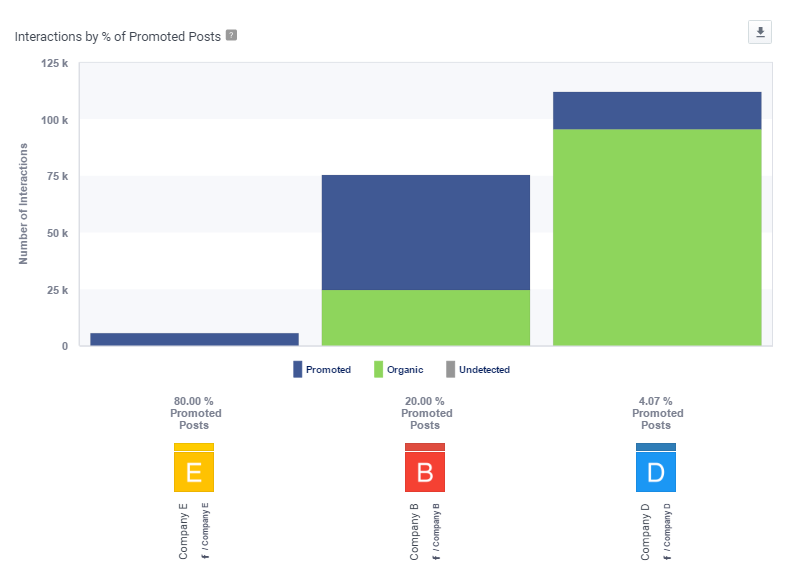
In the example above, we can see that even though a large portion of Company E's and B's Interactions was a result of promoted posts. Though Company D received more interactions overall, a small number of their promoted posts received Interactions. Meanwhile, almost all of Company E's Interactions were a result of their promoted posts. This indicates that Company E and B should reassess their promotion strategy, and perhaps learn from Company D's success.
If you are examining one or two pages or profiles, you will be presented with a Posts in Time chart.
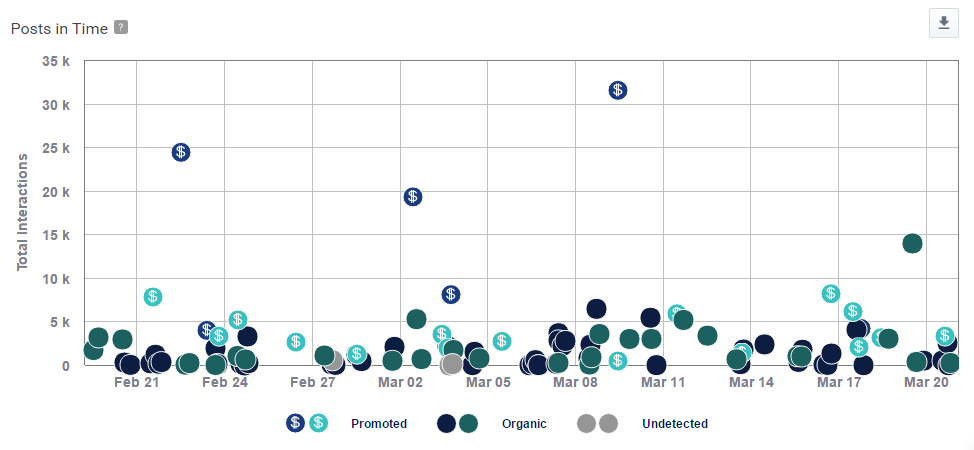
In this case, you will get a breakdown of individual Promoted as well as Organic posts and be able to see how each Post is performing in terms of Interactions. The higher each dot is positioned, the more interactions it received. In this example, the two compared profiles (light and dark blue one) seem to have more of an organic strategy. The dark blue posts on the top with a higher number of interactions are there because they were likely heavily promoted.
Learn about how Promoted Post Detection works for Instagram here.